Elastic XDR
This chapter introduces the core principles of Elastic Extended Detection and Response (XDR), the cybersecurity foundation underlying the NetEye platform’s threat detection and response capabilities. Understanding how Elastic XDR works helps users interpret security findings, tune detection rules, and respond to incidents more effectively.
XDR correlates data from various sources across the IT environment — endpoints, network, email security, identity, access management, cloud, and more — and detects and responds to cyber threats across the environment represented by this dataset, providing a unified security approach.
How Elastic XDR Works
Elastic XDR is built on top of the Elastic Stack, leveraging its core capabilities — data ingestion, search, analytics, and visualization — to enable real-time threat detection and incident response across your entire environment.
At a high level, Elastic XDR operates through the following functional stages:
Data Ingestion from Diverse Sources
Elastic XDR collects and centralizes events and telemetry from multiple sources, including Endpoints (e.g., Elastic Agent), Network appliances (e.g. firewalls, routers, switches or wireless controllers), Cloud infrastructure (e.g., AWS, Azure, GCP logs), on premise applications (e.g. DNS services, web applications, mail gateways or databases) and security consoles, which include external security sources like XDR systems or vulnerability assessment applications. Elastic Agent is the main software component playing a critical role in gathering logs, metrics, and security signals from organization sources. Elastic provides a lot of integrations allowing users to have scalable ingestion and monitoring in heterogeneous environments.
Normalization and Enrichment
Once ingested, raw data is normalized into a common schema (ECS, Elastic Common Schema) using some data processors that are organized into normalization pipelines (ingest or logstash ones). This harmonization makes it easier to correlate events from different systems and apply consistent detection logic. Enrichment is then applied using such context as - GeoIP and threat intelligence lookups - Asset tagging - User context - MITRE ATT&CK mappings
Detection and Correlation
Elastic XDR uses prebuilt and custom detection rules to identify suspicious behaviors, known indicators of compromise (IOCs), exploitation of vulnerabilities (CVE), etc. against different organization sources. Elastic XDR detection logic is powered by different languages: KQL (Kibana Query Language), Lucene, EQL (Event Query Language) and ES|QL (Elastic Query Language).
Detection capabilities include: - Signature-based detection - Behavioral analytics - Anomaly detection via machine learning jobs - Cross-source correlation of events (e.g., lateral movement detection) - Threat intellingence matching - Never-seen-before detection (see the New Terms rule type)
Detected events are promoted to alerts, and related alerts can be grouped into cases or incidents for investigation.
Investigation and Response
Security analysts can use Kibana’s Security app to pivot from alerts to detailed event timelines, raw log views, and process trees for endpoint data.
Response capabilities include: - Manual investigation workflows (with case management) - Automated response actions (via integrations with SOAR tools or custom webhooks) - Endpoint response actions (e.g., isolate host, kill process, quarantine file)
Elastic’s integration with third-party ticketing systems (e.g., Jira, ServiceNow) enables streamlined escalation and remediation tracking.
Elastic Stack allow users also to configure several different AI providers in order to use them with new AI Assistant app. The AI Assistant app is an internal ELK stack generative AI that helps users during security analysis and investigations. This apps is useful to correlate events, get remediation suggestions, querying for other information, and so on. To use AI Assistant app an Enterprise Elastic License is required.
Security App
Key XDR features in Kibana are centered in Security App - a dedicated workspace for alerts, cases, and EDR endpoint management.
The Security app also provides Detection Rules UI - a rule editor and manager for customizing alert logic. Case Management offered in the app tracks investigations and supports collaborative response workflows.
Detection Engine
At the heart of Elastic XDR is the Detection Engine, which runs rules to identify threats based on:
Predefined threat detection rules from Elastic Security
Custom rules written in EQL or KQL
Anomaly detection jobs powered by machine learning models
Rules can be tuned for specific environments and threat models, with support for scheduling, alert suppression, and thresholding.
The detection engine also allows the creation of exceptions through the UI.
Machine Learning Integration
Elastic XDR leverages built-in ML capabilities for:
Unsupervised anomaly detection (e.g., unusual login times or process executions)
Rare process event identification
Behavioral deviation modeling
These jobs are pre-configured and deployable directly from Kibana with minimal tuning, but also support custom modeling for advanced users.
Elastic Defend
Elastic XDR includes its own EDR software that can be installed on endpoints through Defend integration. The Defend integration includes its own detection logic based on different capabilities like signature-base detection, in-memory payload detection (YARA rules) and anomaly detection. All this logic is executed on endpoint side. Defend integration could be configured in detect or in prevent mode, i.e. a complete EDR with prevent mode and response action or data collection only.
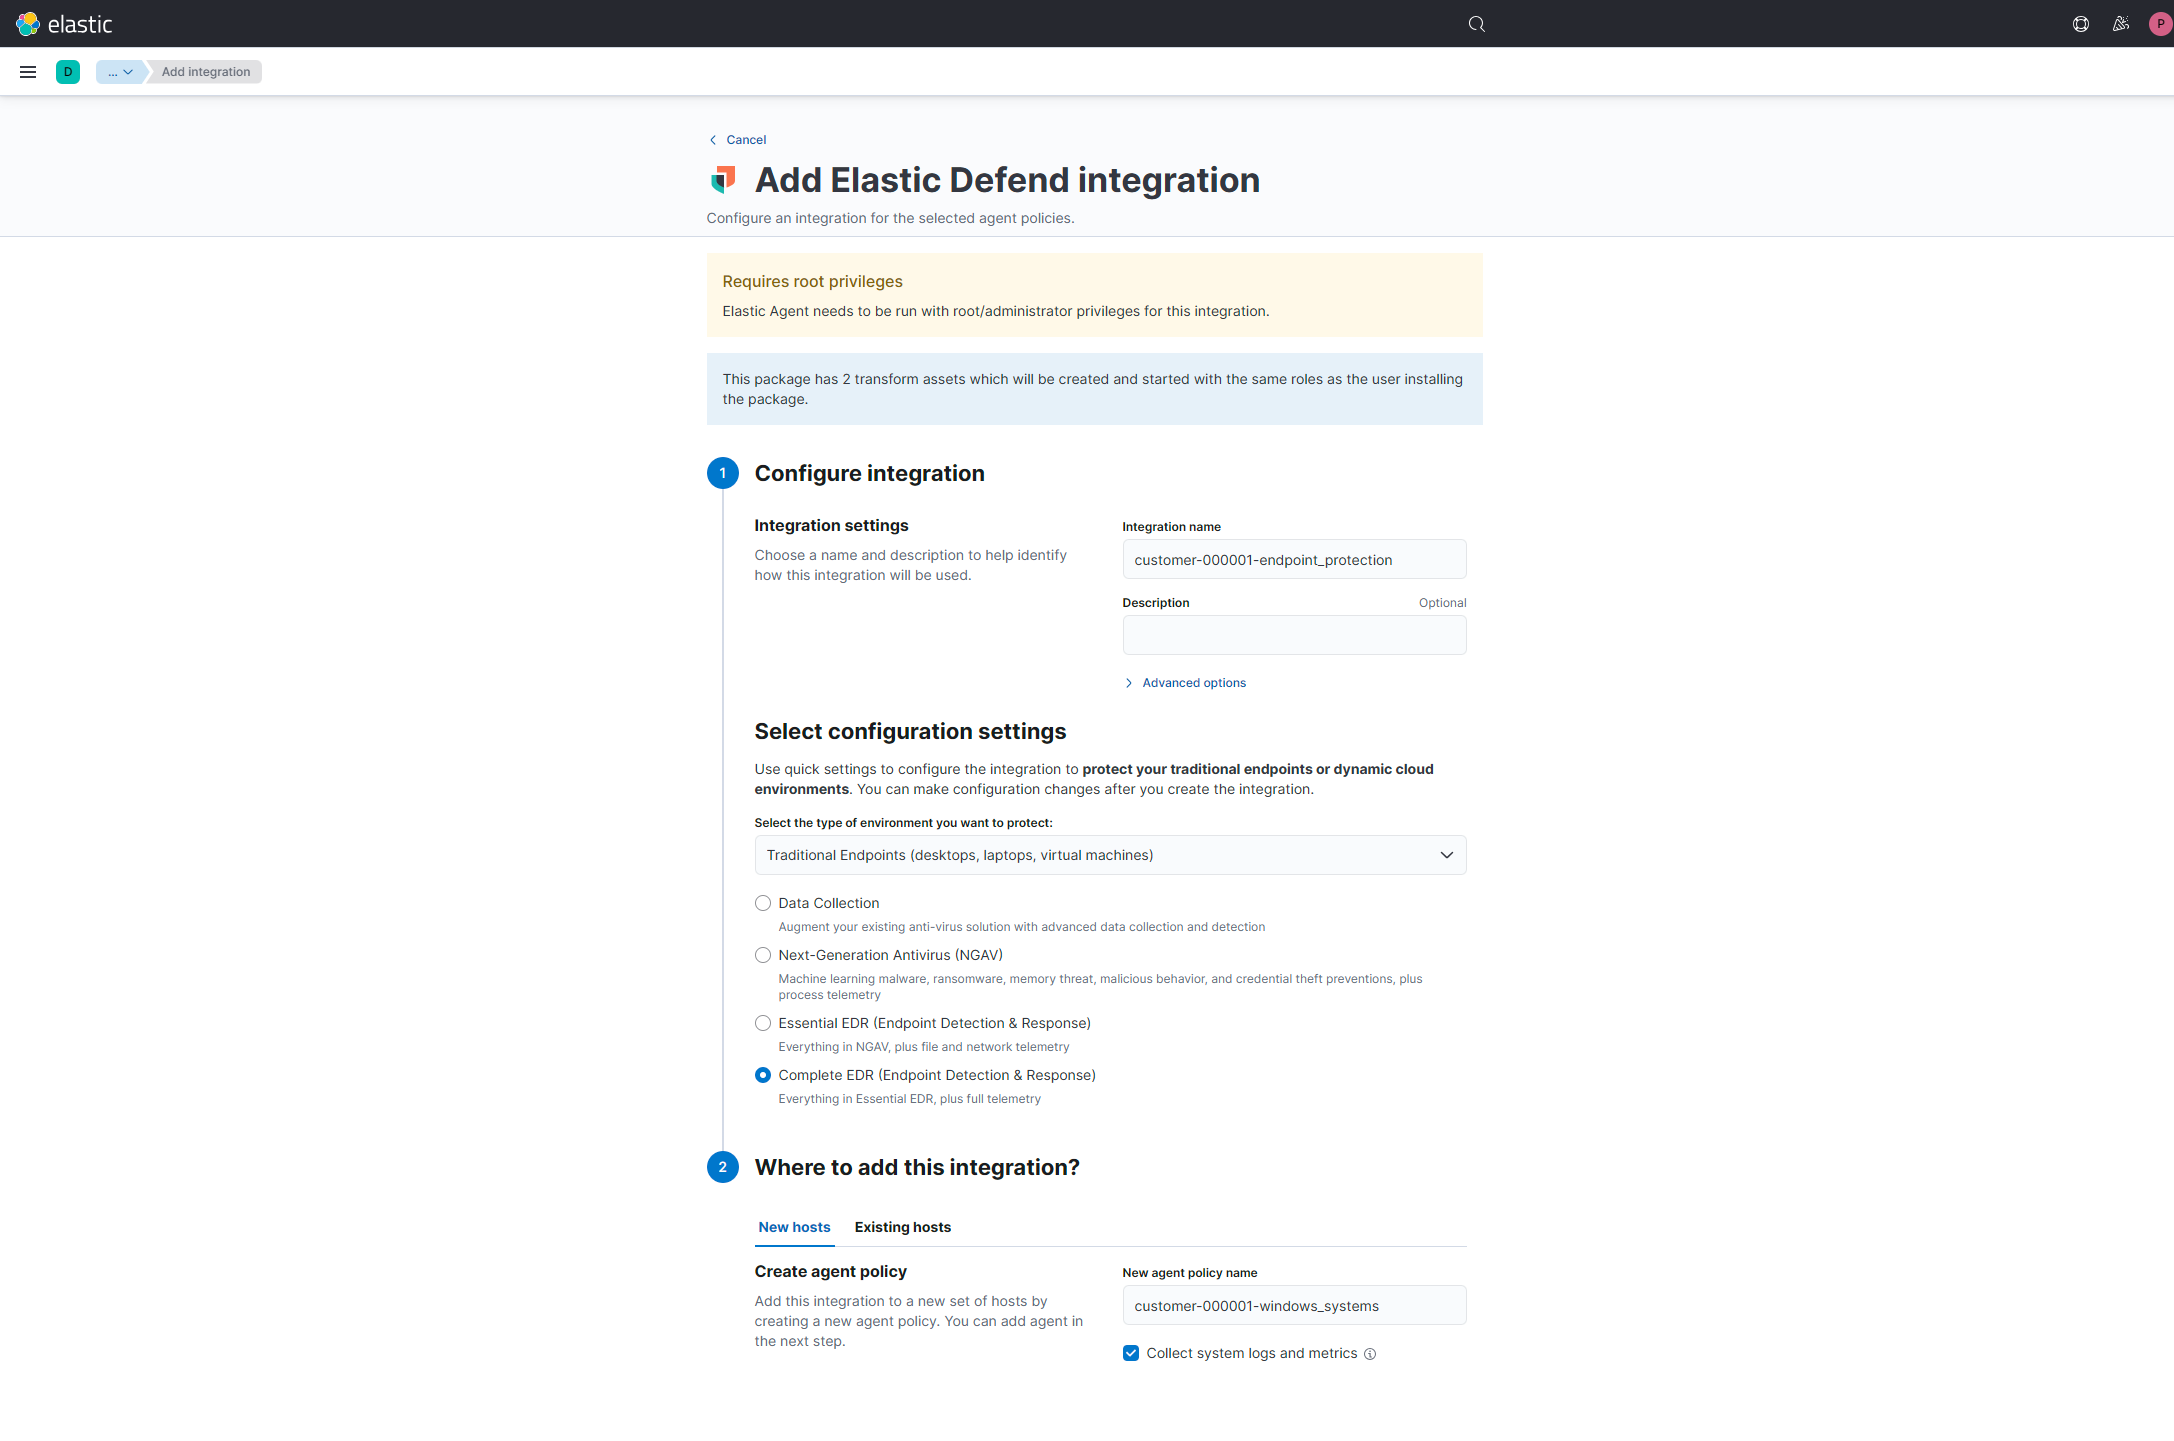
Fig. 162 Rule definition UI
In prevent mode the EDR also prevents the detected behavior to happen causing damage on the endpoint or a compromization/exfiltration of data.
You should use Elastic Defend with Elastic Security for full endpoint detection, prevention, and response capabilities — the foundation of Elastic’s XDR solution. For best results, it is recommended to install Elastic Agent with Elastic Defend in prevention mode on all critical endpoints to unlock the complete Elastic Security experience.
In the case with alerts related to Elastic Agent endpoints where Defend integration is in use, analysts can take direct response actions from the UI of a response colsole, including:
Isolate host: Cut off network access to limit lateral movement
Kill process: Terminate malicious or suspicious processes
Execute command: run any Powershell, Bash, Shell command directly on the machine with root/SYSTEM permissions
Scan a path: detect if malicious artifacts are still present in folders/files using Defend detection logic
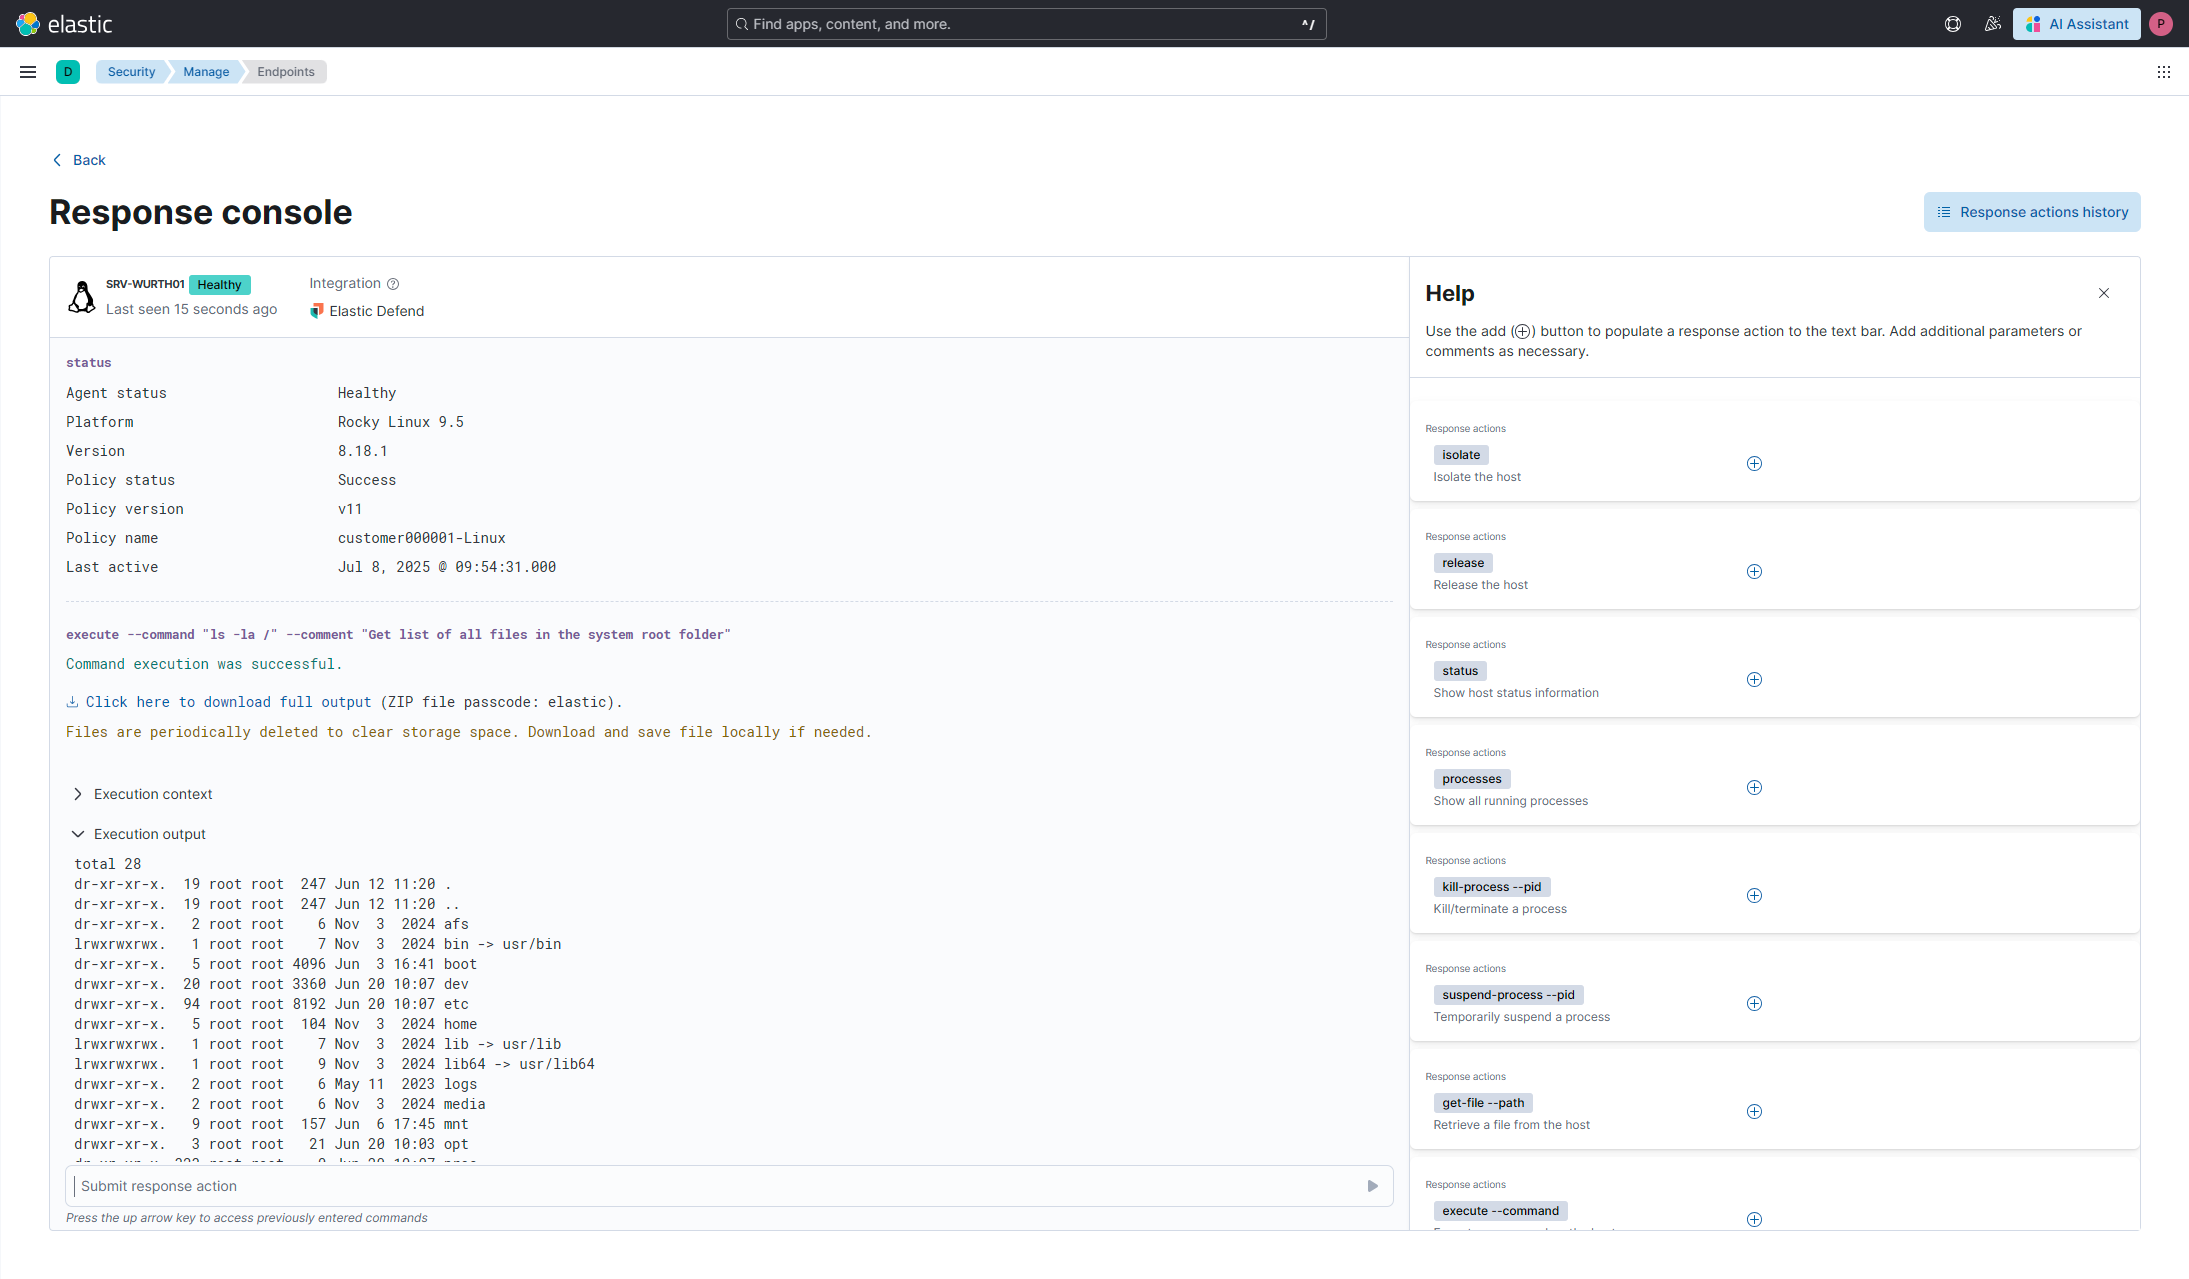
Fig. 163 Response console
Monitoring and Tuning Detection Rules
Each detection rule in Elastic XDR generates alerts when conditions are met. Rules may need tuning to better fit your organization’s systems, policies, and expected behavior. Common tuning actions include:
Adjusting thresholds (e.g., increase failed login count from 5 to 10)
Narrowing scope (e.g., exclude known admin accounts or internal IP ranges)
Modifying queries using filters to reduce noise
Suppressing alerts for repeat benign behavior using built-in suppression logic
Disabling non-relevant rules for technologies or attack vectors not in use
You can edit rule definitions directly in the Rules UI or clone and modify prebuilt rules to suit your environment.
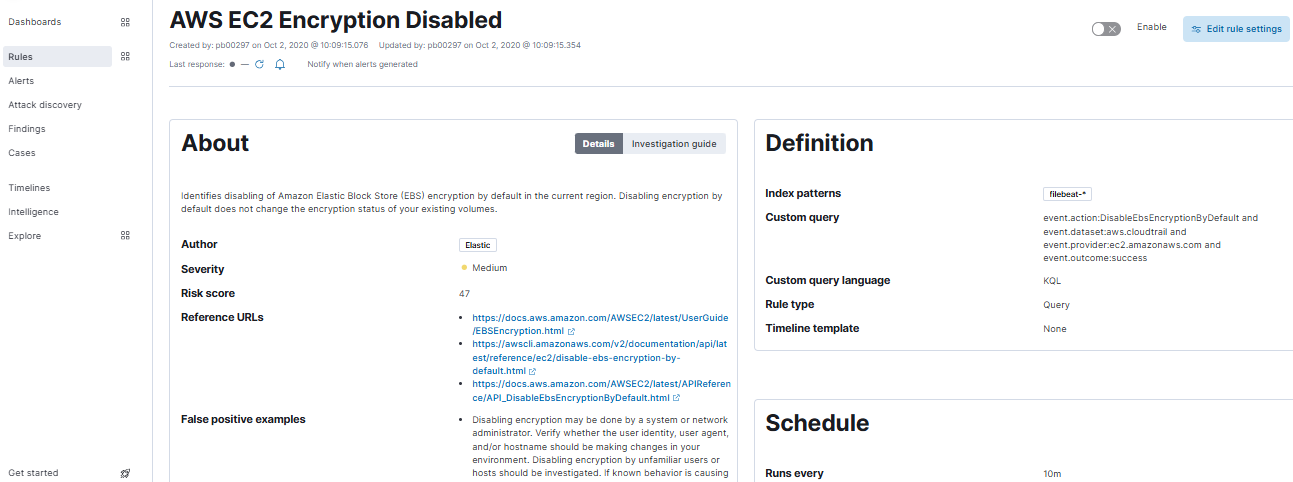
Fig. 164 Rule definition UI
Note
From Elastic v8.18 prebuilt rules could be adjusted/edited without the need of cloning them. Prebuilt Elastic detection rules list could change depending on the Elastic Stack version or over-the-air updates. Check out a complete changelog for the Elastic v8.18.
Custom Rule Development
In addition to prebuilt rules, you can write custom rules using different languages:
KQL (Kibana Query Language) - the main language used on UI side; most effective for simple atomic queries.
Lucene - an alternative to KQL but rarely used in detection logic. It useful when regex in detection logic is needed.
EQL (Event Query Language) - allows correlation of multiple events to match a sequence of activities.
ES|QL (Elastic Query Language) - an SQL-like syntax for complex queries.
All of the above allow detecting all types of use cases - from simple to quite complex.
Prebuilt and custom detection logic depends also on rule types. Each rule type address a specific use case. There is the simple query type detecting when a single atomic condition is met (e.g. modification of a registry key). There is the threshold type detecting when multiple events happens in a time window (e.g. multiple failed logons in a small period of time). There is the threat match type detecting when an event contains known indicators of compromise stored in TI source (e.g. an IP address reported by MISP platform). There is the machine learning type detecting when suspicious behavioral events happens (e.g. a user logged into a system in usual hours or weekdays).
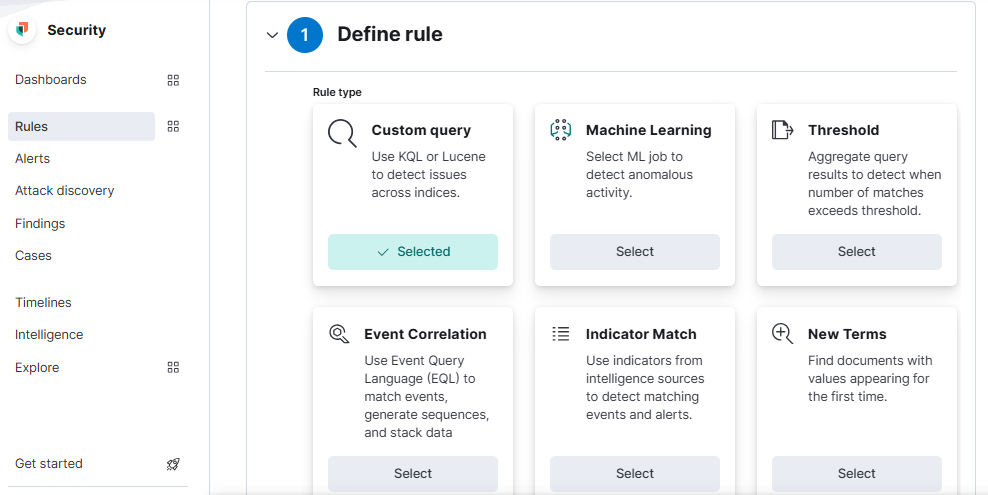
Fig. 165 Detection rule types
Learn more details about detection rule types in the official Elastic documentation.
When creating custom rules:
Use ECS-compliant fields for maximum compatibility.
Include clear descriptions, severity levels, and mappings to MITRE ATT&CK.
Test rules against historical data using Timeline before enabling.
Use the right index patterns, tailored to your specific use case (for example logs-apache.* instead of logs-* for Apache Web Server). More specific patterns allow better performance for the detection engine.
Set the Timestamp override field to event.ingested field. This can help reduce missing alerts due to network or server outages; this represents the time considered by the detection logic on its runs (time window is calculated on this field); event.ingested contains the time when the event is indexed into Elasticsearch
Set the right time window on which the detection rule should run.
Set the appropriate Additional look-back time to avoid missing alerts from coming up.
Rule Exceptions
Elastic XDR supports rule exceptions to prevent known benign behaviors from generating alerts. Examples include:
Legitimate software that mimics suspicious behavior
Recurring but harmless admin scripts
Specific hosts or services with known behavior patterns
Exceptions are managed through the Exceptions tab on each rule and can be scoped narrowly (e.g., specific user and process combination) to maintain detection fidelity.
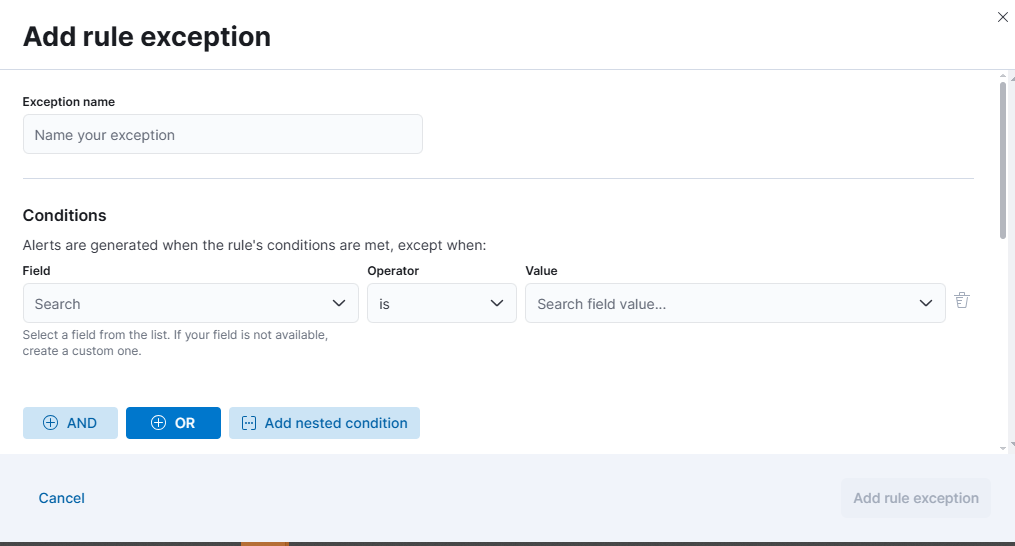
Fig. 166 Definition of a Rule exception
Endpoint Exceptions
Endpoint Exceptions are available only on Endpoint Security rules.They are applied on endpoint side, not on the Kibana side, to avoid EDR blocking legit behaviors on hosts. Endpoint Exceptions can be created using a UI guide form like Rule Exceptions.
Check out official documentation for more details.
Trusted applications
Some user application may be detected by XDR as malicious. Adding the user applications to the trusted list will reduce false positives and allow actual user application to perform regular operations without being blocked by Elastic Security.
Blocklist
Add applications to a blocklist to prevent them from running on your hosts, extending the list of processes that Endpoint Security considers malicious.
Responding to Threats with Elastic XDR
Elastic XDR not only detects threats, but empowers security teams to investigate efficiently and respond decisively. This section explains how users can interact with alerts, investigate potential incidents, and take response actions using the built-in tools and integrations provided by the Elastic Security solution.
Alert Management and Investigation Workflow
When a detection rule is triggered, it generates an alert. Each alert includes:
Rule name and severity
Description and expected behavior
Enriched event data (e.g., process, user, host, network details)
MITRE ATT&CK technique mappings
Users can triage alerts using the Alerts view in Kibana, which supports:
Filtering by rule, host, or severity
Grouping related alerts into cases
Pinning alerts to Timelines for deeper inspection
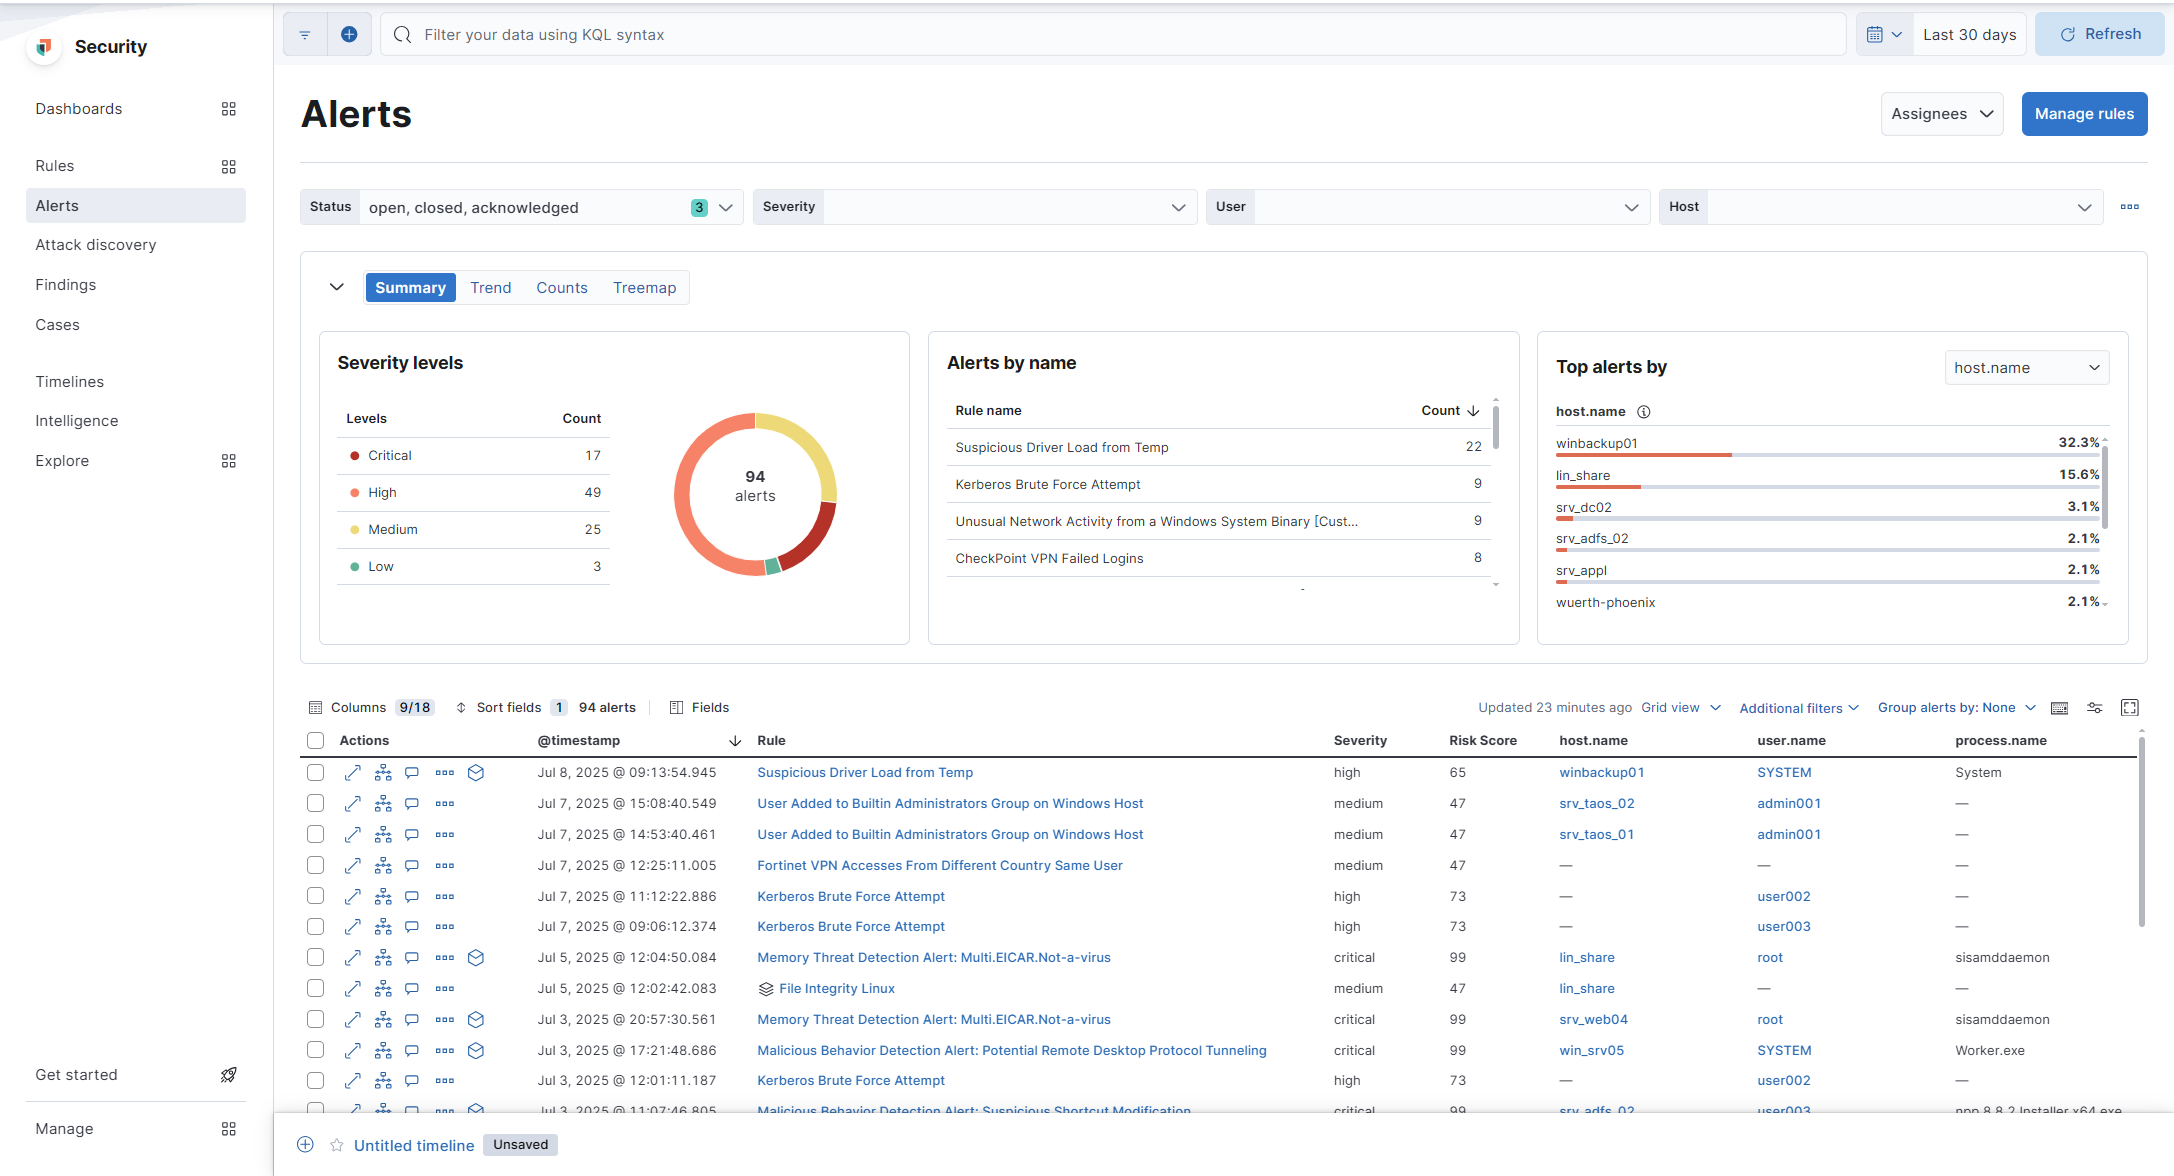
Fig. 167 Alerts view in Kibana
Case Management
Elastic XDR includes built-in case management to track investigations and collaborate across teams. Users can:
Create cases from alerts or timelines
Assign cases to team members
Attach artifacts (alerts, notes, links, observables)
Push cases to third-party systems like Jira
Automated Response Actions
Elastic XDR supports automated responses through:
Connector actions (webhooks, emails, external systems)
SOAR integrations with security orchestration tools (e.g., Swimlane, Tines, Splunk SOAR)
Automation can be used to escalate alerts, enrich data, notify teams, or initiate containment steps.