SATAYO Findings
Findings represent the result of the analysis performed on evidence collected during regular SATAYO scans. The frequency of running scans is defined in a dedicated Scan times by type of Findings section.
The search process is based on the asset domains that are identified, mapped, and configured during the onboarding phase with a SATAYO analyst. These domains define the monitoring perimeter and serve as the foundation for detecting relevant findings.
The evidence is gathered from publicly accessible sources and correlated to identify elements that contribute to the organization’s external exposure. This exposure is represented through the Attack Surface Index, a numerical value calculated based on the collected evidence and associated findings.
The index ranges from 0 to 100, where 0 indicates no detected exposure and 100 represents the maximum level within the scoring model. Higher values indicate a broader external attack surface, meaning a greater amount of publicly available information and potentially exploitable elements.
The value of the index is also influenced by the size and digital footprint of the organization. Larger organizations with more domains, services, and publicly accessible assets may naturally present higher index values.
With each new scan, newly identified findings are compared with those previously detected. This ensures that the list is continuously updated, highlighting new elements while maintaining visibility on existing ones and their current status.
Findings are grouped into three main categories:
Infrastructure
Data Files & People
Deep & Dark Web
These categories reflect different areas of exposure and collectively contribute to the evaluation of the organization’s Attack Surface Index.
A dedicated Findings page provides a complete and up-to-date list of all detected findings. The structure and details of this page are described in the following sections.
Working with the Findings Page
All detected findings are available on a dedicated Findings page, which provides a consolidated view of the evidence identified during SATAYO scans. This page allows you to explore and review findings across the monitored environment and to focus on the areas that require attention.
Findings can be filtered to narrow the scope of the analysis. Users may limit the view to a specific organization (when associated with multiple organizations) or focus on a particular domain within the monitored perimeter. Findings can also be filtered by their type, which helps identify specific categories of exposure. The full range of finding types is described in the following chapters.
Additional filtering options allow findings to be viewed according to their related ticket attributes, such as ticket status or priority. In general, tickets are created and managed as part of the regular workflow used to process and address detected findings.
Each finding is associated with an identifier that indicates the type of issue detected. These identifiers are not unique and should be understood as attributes used to categorize findings rather than as individual reference numbers.
For deeper investigation, users can open the detailed view of a finding. This view provides additional context and supporting information about the detected evidence, helping users better understand the nature and potential impact of the issue.
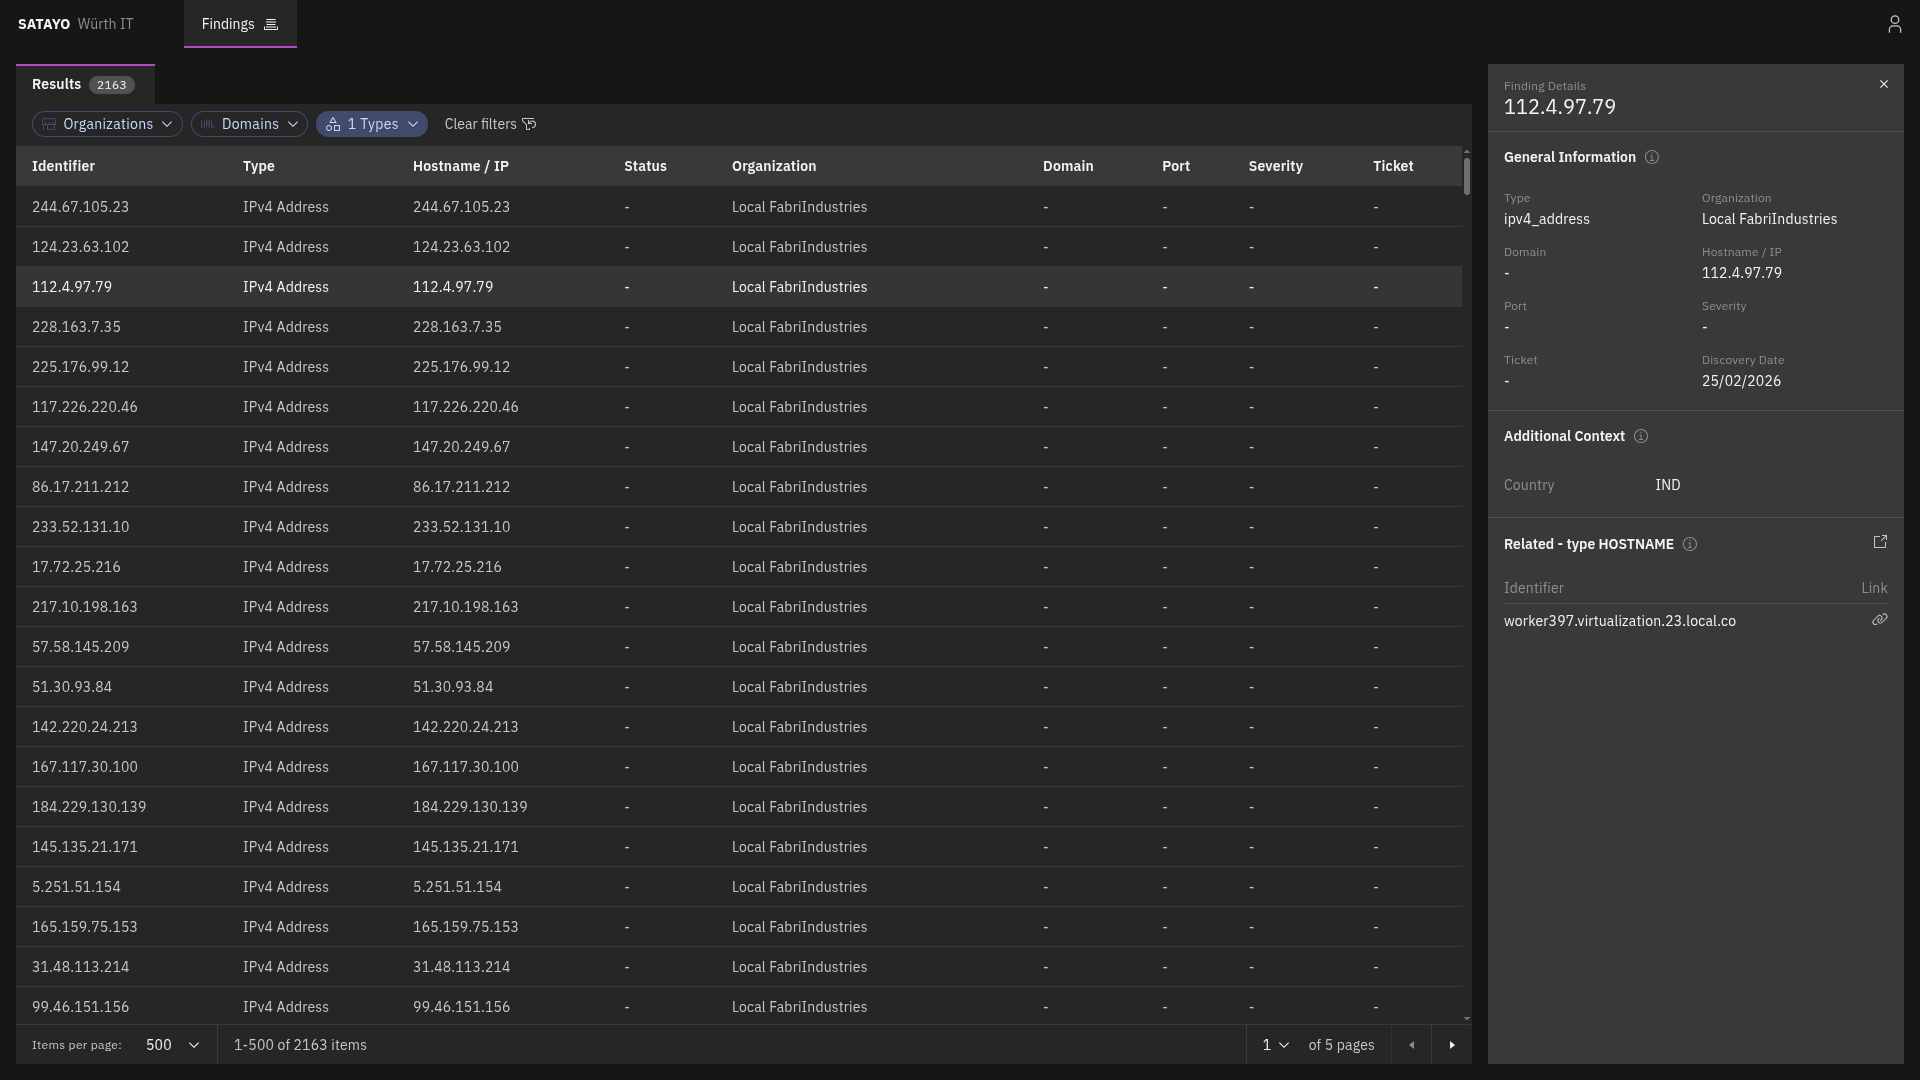
Fig. 211 List of items with the preview panel open of a selected item
From the detailed view, clicking on the icon near the Related title opens another tab with the list filtered to show its related findings. Clicking on the link icon on a related finding opens the same view, with the corresponding finding’s preview panel automatically displayed.
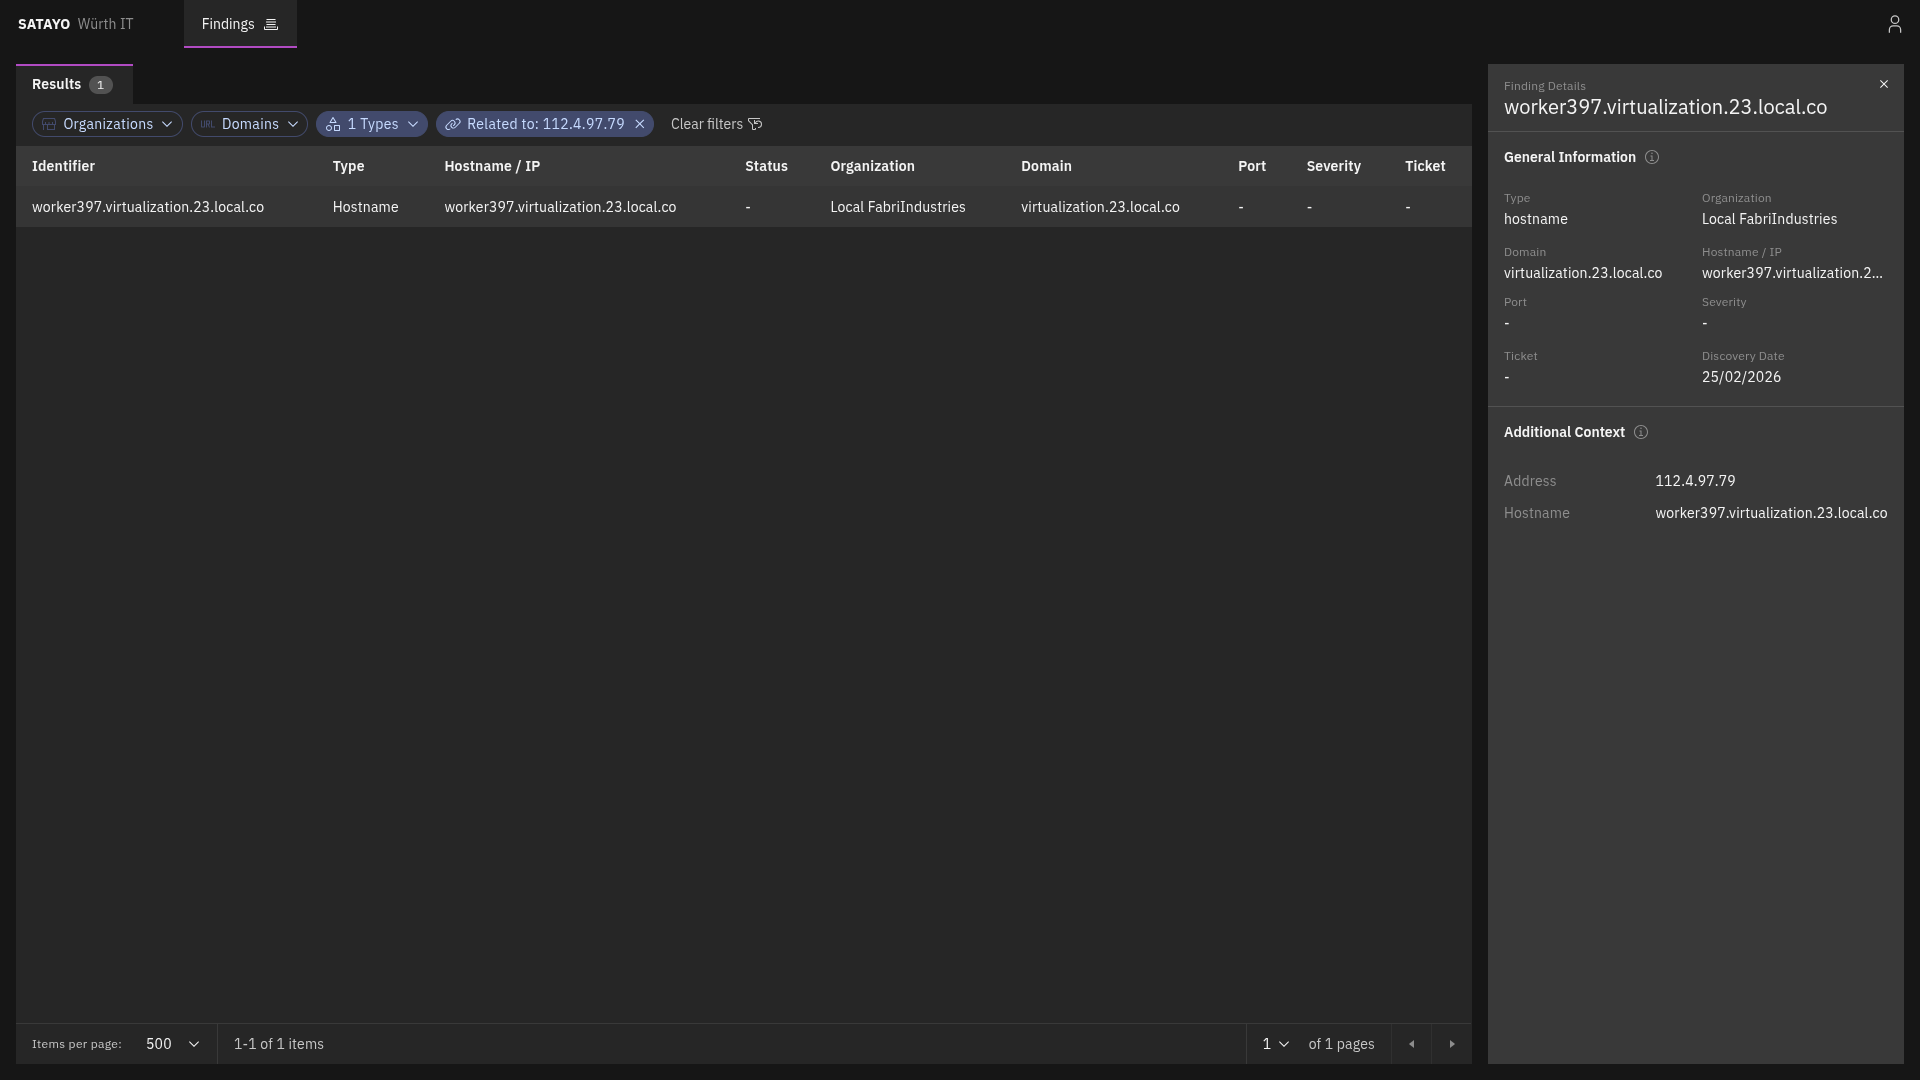
Fig. 212 List of related items with the preview panel open of a selected item
Domain
MITRE ATT&CK Techniques
The following MITRE ATT&CK techniques are used to classify this finding:
Reconnaissance
The domain findings list all subdomains discovered for each configured monitored domain. They act as a starting point to explore all other findings related to a specific domain. Domains are identified through multiple finding types during SATAYO scans, such as Hostnames or Stealer Logs.
Note
The domain sub-types — Suspicious, Correlated, Similar, TLD, and Phishing — listed in the Scan times by type of Findings table refer to the configured monitored domain itself, not to the domain findings described here.
Domain findings act as aggregators: each finding collects related evidence discovered under the same domain. Currently, a domain finding can aggregate Hostnames, Email addresses and Stealer Logs related to the same domain.
When a domain is found through a Stealer Log, the finding includes a severity field that reflects how sensitive the associated resource is, based on the type of website recorded in the log. The severity levels are:
RISK ACCEPTED — the resource is considered low risk.
POTENTIALLY CRITICAL — the resource may pose a significant risk and warrants review.
CRITICAL — the resource is a high-value target, such as an intranet website, password manager, private cloud, or administrative page.
The severity classification is assigned by SATAYO but can be adjusted on request if the assigned level does not reflect the actual sensitivity of the resource.
Hostname
MITRE ATT&CK Techniques
The following MITRE ATT&CK techniques are used to classify this finding:
Reconnaissance
Hostname, like IP addresses, is one of the items that SATAYO finds during its analysis. It is a human-readable name that corresponds to an IP address, making it easier to identify and remember. They are one of the starting points for SATAYO’s exposure assessment analysis, and they can provide valuable information about the services and applications running on a network.
They also work as aggregators for other items, such as Services, Mail servers, Mail, SSL/TLS certificates, and more.
They do not contribute directly to the EAIV score, as their mere existence doesn’t pose a risk.
IPv4 Address
MITRE ATT&CK Techniques
The following MITRE ATT&CK techniques are used to classify this finding:
Reconnaissance
The IPv4 address item represents a publicly reachable IP address discovered by SATAYO. It can be correlated to other items, such as Ports and Hostnames.
Port
MITRE ATT&CK Techniques
The following MITRE ATT&CK techniques are used to classify this finding:
Reconnaissance
Each port item complements an IPv4 address item and represents an exposed port on which a service or application at the IP address is listening.
Registry
MITRE ATT&CK Techniques
The following MITRE ATT&CK techniques are used to classify this finding:
Reconnaissance
The registry item consists of the subnet blocks where the retrieved found IP address resides. The addresses inside are scanned to see if there are other resolvable hostnames that, if found, are added to the list of hostnames and constitute an additional base for future scans and analysis.
CVE
MITRE ATT&CK Techniques
The following MITRE ATT&CK techniques are used to classify this finding:
Reconnaissance
Resource Development
Initial Access
The CVE item represents a publicly known vulnerability identified on a specific host during SATAYO analysis. Each item corresponds to a single CVE identifier detected on a particular host. If multiple vulnerabilities are discovered on the same host, a separate CVE item is created for each vulnerability.
For each vulnerability, SATAYO provides a link to the U.S. National Vulnerability Database (NVD), maintained by the National Institute of Standards and Technology (NIST), where detailed technical information about the CVE can be found.
When available, SATAYO also provides links to publicly known exploits or Proof-of-Concept (PoC) implementations associated with the vulnerability.
Additional contextual indicators are included to help prioritize remediation:
KEV (Known Exploited Vulnerabilities) — Indicates whether the vulnerability is listed in the catalog maintained by the Cybersecurity and Infrastructure Security Agency (CISA), which tracks vulnerabilities that are known to be actively exploited in the wild.
EPSS (Exploit Prediction Scoring System) — A data-driven model that estimates the probability that a vulnerability will be exploited in real-world attacks. The EPSS model produces a probability score expressed as a percentage (0–100%). The higher the score, the greater the likelihood that the vulnerability will be exploited.
EPSS is managed by Forum of Incident Response and Security Teams (FIRST), and SATAYO is included in the official list of EPSS-supported vendors.
Service
MITRE ATT&CK Techniques
The following MITRE ATT&CK techniques are used to classify this finding:
Reconnaissance
A service item represents a specific service or application exposed over HTTP on a particular port of an IP address and identified by a hostname.
It is always associated with a hostname, because the hostname is a determining factor in request routing. The HTTP server may use the hostname to route requests to the appropriate virtual host or service.
It provides information about the exposed HTTP service and web server, including:
Open ports with SSL/TLS enabled
Open ports without SSL/TLS enabled
Also service metadata, such as:
HTML title
meta-generator
maintainer email addresses
exposed server headers
unencrypted protocols in use
detected technologies
Linked Domains
The following five finding types are grouped in this category because they all refer to domains. For each detected domain, information such as registrant, country, and creation date is shown. If SATAYO finds MX record details or blacklist presence, this information is also shown.
Domain Suspicious
MITRE ATT&CK Techniques
The following MITRE ATT&CK techniques are used to classify this finding:
Reconnaissance
A Domain suspicious item shows domains classified as suspicious because they contain the company name.
Domain Phishing
MITRE ATT&CK Techniques
The following MITRE ATT&CK techniques are used to classify this finding:
Reconnaissance
The Domain phishing item shows known malicious domains or URLs that are currently performing phishing activities.
Domain Similar
MITRE ATT&CK Techniques
The following MITRE ATT&CK techniques are used to classify this finding:
Reconnaissance
The Domain similar item shows all registered domains similar to the main one. These domains could be used for phishing activities. If a domain was registered recently, chances are that it can be used for malicious purposes.
Domain TLD
MITRE ATT&CK Techniques
The following MITRE ATT&CK techniques are used to classify this finding:
Reconnaissance
The Domain TLD item shows all top-level domains registered with the same base name as the main domain.
Stealer Logs
MITRE ATT&CK Techniques
The following MITRE ATT&CK techniques are used to classify this finding:
Reconnaissance
The Stealer Logs item is a collection (logs) of compromised data associated with your monitored domain, distributed through underground marketplaces. They originate from infections caused by “stealer” malware (often delivered via trojanized or cracked software) which exfiltrates data from infected systems, including browser-stored credentials, session cookies, autofill data, and other locally stored secrets.
Email Address
MITRE ATT&CK Techniques
The following MITRE ATT&CK techniques are used to classify this finding:
Reconnaissance
The Email Address item shows the email address belonging or related to a domain under analysis. It indicates whether an account with that email address was present in a stealer log.
Emails shown here were retrieved by SATAYO through the acquisition of stealer logs, which are collections of compromised data associated with your monitored domain, distributed by third parties through underground marketplaces.
Resource
MITRE ATT&CK Techniques
The following MITRE ATT&CK techniques are used to classify this finding:
Reconnaissance
The Resource item represents a finding associated with a specific URL. A resource is reported when it is referenced in an entry of a stealer log containing a username or password for an account associated with that specific URL.
Account
MITRE ATT&CK Techniques
The following MITRE ATT&CK techniques are used to classify this finding:
Reconnaissance
Credential Access
An Account item represents an online account associated with your organization that has been identified in compromised data sources, such as stealer logs or data breaches. Accounts are flagged when they appear in a stealer log or breach containing exposed credentials or session information.
For each account found, SATAYO provides information about:
Username associated with the account
The resource associated with the account
Presence in stealer logs/data breaches and related email addresses (if present)
It is recommended to verify the authenticity of any account found in this section and take immediate action by resetting credentials and enabling multi-factor authentication if available.