
User Guide Functional Overview Requirements Architecture System Installation NetEye Additional Components Installation Setup The neteye Command Director NetEye Self Monitoring Tornado Business Service Monitoring IT Operation Analytics - Telemetry Geo Maps NagVis Audit Log Shutdown Manager Reporting ntopng Visual Monitoring with Alyvix Elastic Stack IT Operations (Command Orchestrator) Asset Management Service Level Management Cyber Threat Intelligence - SATAYO NetEye.Cloud Solution Monitoring Business Service Monitoring Asset Management ELK - Log Analytics SOC System Administrator SOC Attacker Centric Cyber Threat Intelligence - SATAYO NetEye Update & Upgrade Backup and Restore How To NetEye Extension Packs Troubleshooting Security Policy Glossary
module icon ELK - Log Analytics
Getting Started with ELK Analytics Overview Discover Dashboards Canvas Maps Machine Learning Graph Visualize Library Observability Overview Alerts Service Level Objectives (SLOs) Cases Logs Infrastructure Applications Synthetic Monitoring User Experience (RUM)
NetEye.Cloud Solution Monitoring Business Service Monitoring Asset Management ELK - Log Analytics SOC System Administrator SOC Attacker Centric Cyber Threat Intelligence - SATAYO Introduction to NetEye Monitoring Business Service Monitoring IT Operation Analytics Visualization Network Visibility Log Management & Security Orchestrated Datacenter Shutdown Application Performance Monitoring User Experience Service Management Service Level Management & Reporting Requirements for a Node Cluster Requirements and Best Practices Kubernetes Networking NetEye Satellite Requirements TCP and UDP Ports Requirements Additional Software Installation Introduction Single Node Cluster Kubernetes NetEye Master Master-Satellite Architecture Underlying Operating System Acquiring NetEye ISO Image Installing ISO Image Single Nodes and Satellites Cluster Nodes Configuration of Tenants Satellite Nodes Only Nodes behind a Proxy Additional NetEye Components Satellites Nodes only Verify if a module is running correctly Accessing the New Module Cluster Satellite Security Backup and Restore Identity and Access Management External Identity Providers Configure federated LDAP/AD Emergency Reset of Keycloak Configuration Keycloak Hostname Configuration Advanced Configuration Roles Single Page Application in NetEye Module Permissions and Single Sign On Within NetEye Importing User Federation Groups inside another Group Importing OIDC IdP Groups inside another Group Resource Tuning Advanced Topics Basic Concepts & Usage Advanced Topics Monitoring Environment Templates Monitored Objects Import Monitored Objects Data Fields Deployment Icinga 2 Agents Configuration Baskets Dashboard Monitoring Status Integration with Elasticsearch VMD Permissions Notifications Jobs API Configuring Icinga Monitoring Retention Policy NetEye Self Monitoring Concepts Collecting Events Add a Filter Node WHERE Conditions Iterating over Event fields Retrieving Payload of an Event Extract Variables Create a Rule Tornado Actions Test your Configuration Export and Import Configuration Example Under the hood Development Retry Strategy Configuration Thread Pool Configuration API Reference Configure a new Business Process Create your first Business Process Node Importing Processes Operators The ITOA Module Configuring User Permissions Telegraf Metrics in NetEye Telegraf Configuration Telegraf on Monitored Hosts Visualizing Dashboards Customizing Grafana The NetEye Geo Map Visualizer Map Viewer Configuring Geo Maps NagVis Audit Log Overview Shutdown Manager user Shutdown Manager GUI Shutdown Commands Advanced Topics Overview User Role Management Cube Use Cases ntopng and NetEye Integration Permissions Retention Advanced Topics Overview User Roles Install Alyvix Core Install Alyvix Service Nodes RDP Client Tutorial Overview Example: Windows Start Button Example: Open Windows Settings Example: Web Browser Test Case Example: Authentication Test Case Alyvix Tutorial Video Index Building Tools Editor: Interface Overview Editor: Script Building Editor: Managing Scripts Designer: Interface Overview Designer: Interface Options Designer: Component Tree Selector: Interface Overview Test Case Execution Test Case Format Test Case Management Dashboard Use Cases Overview Architecture Authorization Kibana Elasticsearch Cluster Elasticsearch Configuration Replicas on a Single Node Elasticsearch Performance tuning Overview Enabling El Proxy Sending custom logs to El Proxy Configuration files Commands Elasticsearch Templates and Retentions El Proxy DLQ Blockchain Verification Handling Blockchain Corruptions El Proxy Metrics El Proxy Security El Proxy REST Endpoints Agents Logstash Rsyslog Elastic APM Elastic RUM Multitenant OpenTelemetry Collector Elastic XDR Overview Authorization in the Command Orchestrator Module Configuring CLI Commands Executing Commands Overview Permissions Installation Plugins Single Tenancy Multitenancy Communication through a Satellite Asset collection methods Display asset information in monitoring host page Overview Customers Availability Event Adjustment Outages Resource Advanced Topics Introduction The Intelligence We Produce Mitre Attack Coverage Getting Started Settings SATAYO Items Intelligence Requirements Managed Service Request Form FAQ Changelog SATAYO Community NetEye.Cloud as a SaaS solution NetEye.Cloud Subscription Base Concepts Authentication Options Authentication via IdP Group Claims for Authorization Management Authentication via Microsoft Entra ID Roles and Permissions Authorization Navigating the UI Monitoring with NetEye.Cloud Monitored Objects Finding and Filtering Hosts Exporting Monitoring Data Viewing Host and Service Details Organizing with Groups Tactical Overview Problems View Dashboard Typical Daily Interactions Scheduled Downtime Notifications and Alerts AutoDiscovery VMD Business Service Monitoring Business Process Logic Business Process View Asset Management in NetEye.Cloud Automatic Inventory Collection Software & License Management Contract & Supplier Management Change & Lifecycle Management Getting Started with ELK Analytics Overview Discover Dashboards Canvas Maps Machine Learning Graph Visualize Library Observability Overview Alerts Service Level Objectives (SLOs) Cases Logs Infrastructure Applications Synthetic Monitoring User Experience (RUM) SOC System Administrator (AdS) Access to NetEye and Elastic Elastic Dashboards Elastic Discover Elastic Alerts Elastic Rules Introduction to SOC Attacker Centric Service Description NetEye SIEM About SATAYO Getting Started Threat Intelligence and Security Operations How SATAYO works MITRE ATT&CK Coverage SATAYO Platform Dashboard SATAYO Findings SATAYO REST API SaaS & Managed Mode Settings SATAYO MCP Server Graph Exploration Pivot Exploration Before you start Update Procedure Single Node Upgrade from 4.50 to 4.51 Cluster Upgrade from 4.50 to 4.51 Satellite Upgrade from 4.50 to 4.51 DPO machine Upgrade from 4.50 to 4.51 Create a mirror of the RPM repository Sprint Releases Feature Troubleshooting Backup and Restore Tornado Networking Service Management - Incident Response IT Operation Analytics - Telemetry Identity Provider (IdP) Configuration NetEye Cluster on Microsoft Azure NetEye Cluster on AWS Introduction to NEP Getting Started with NEPs Online Resources Obtaining NEP Insights Available Packages Advanced Topics NEP Updates & Upgrades Setup Configure swappiness Restarting Stopped Services Enable stack traces in web UI How to access standard logs Director does not deploy when services assigned to a host have the same name How to enable/disable debug logging Activate Debug Logging for Tornado Modules/Services do not start Sync Rule fails when trying to recreate Icinga object How to disable InfluxDB query logging Managing an Elasticsearch Cluster with a Full Disk Some logs are not indexed in Elasticsearch Elasticsearch is not functioning properly Reporting: Error when opening a report Debugging Logstash file input filter Bugfix Policy Reporting Vulnerabilities Cyber Resilience Act Compliance Glossary

Discover

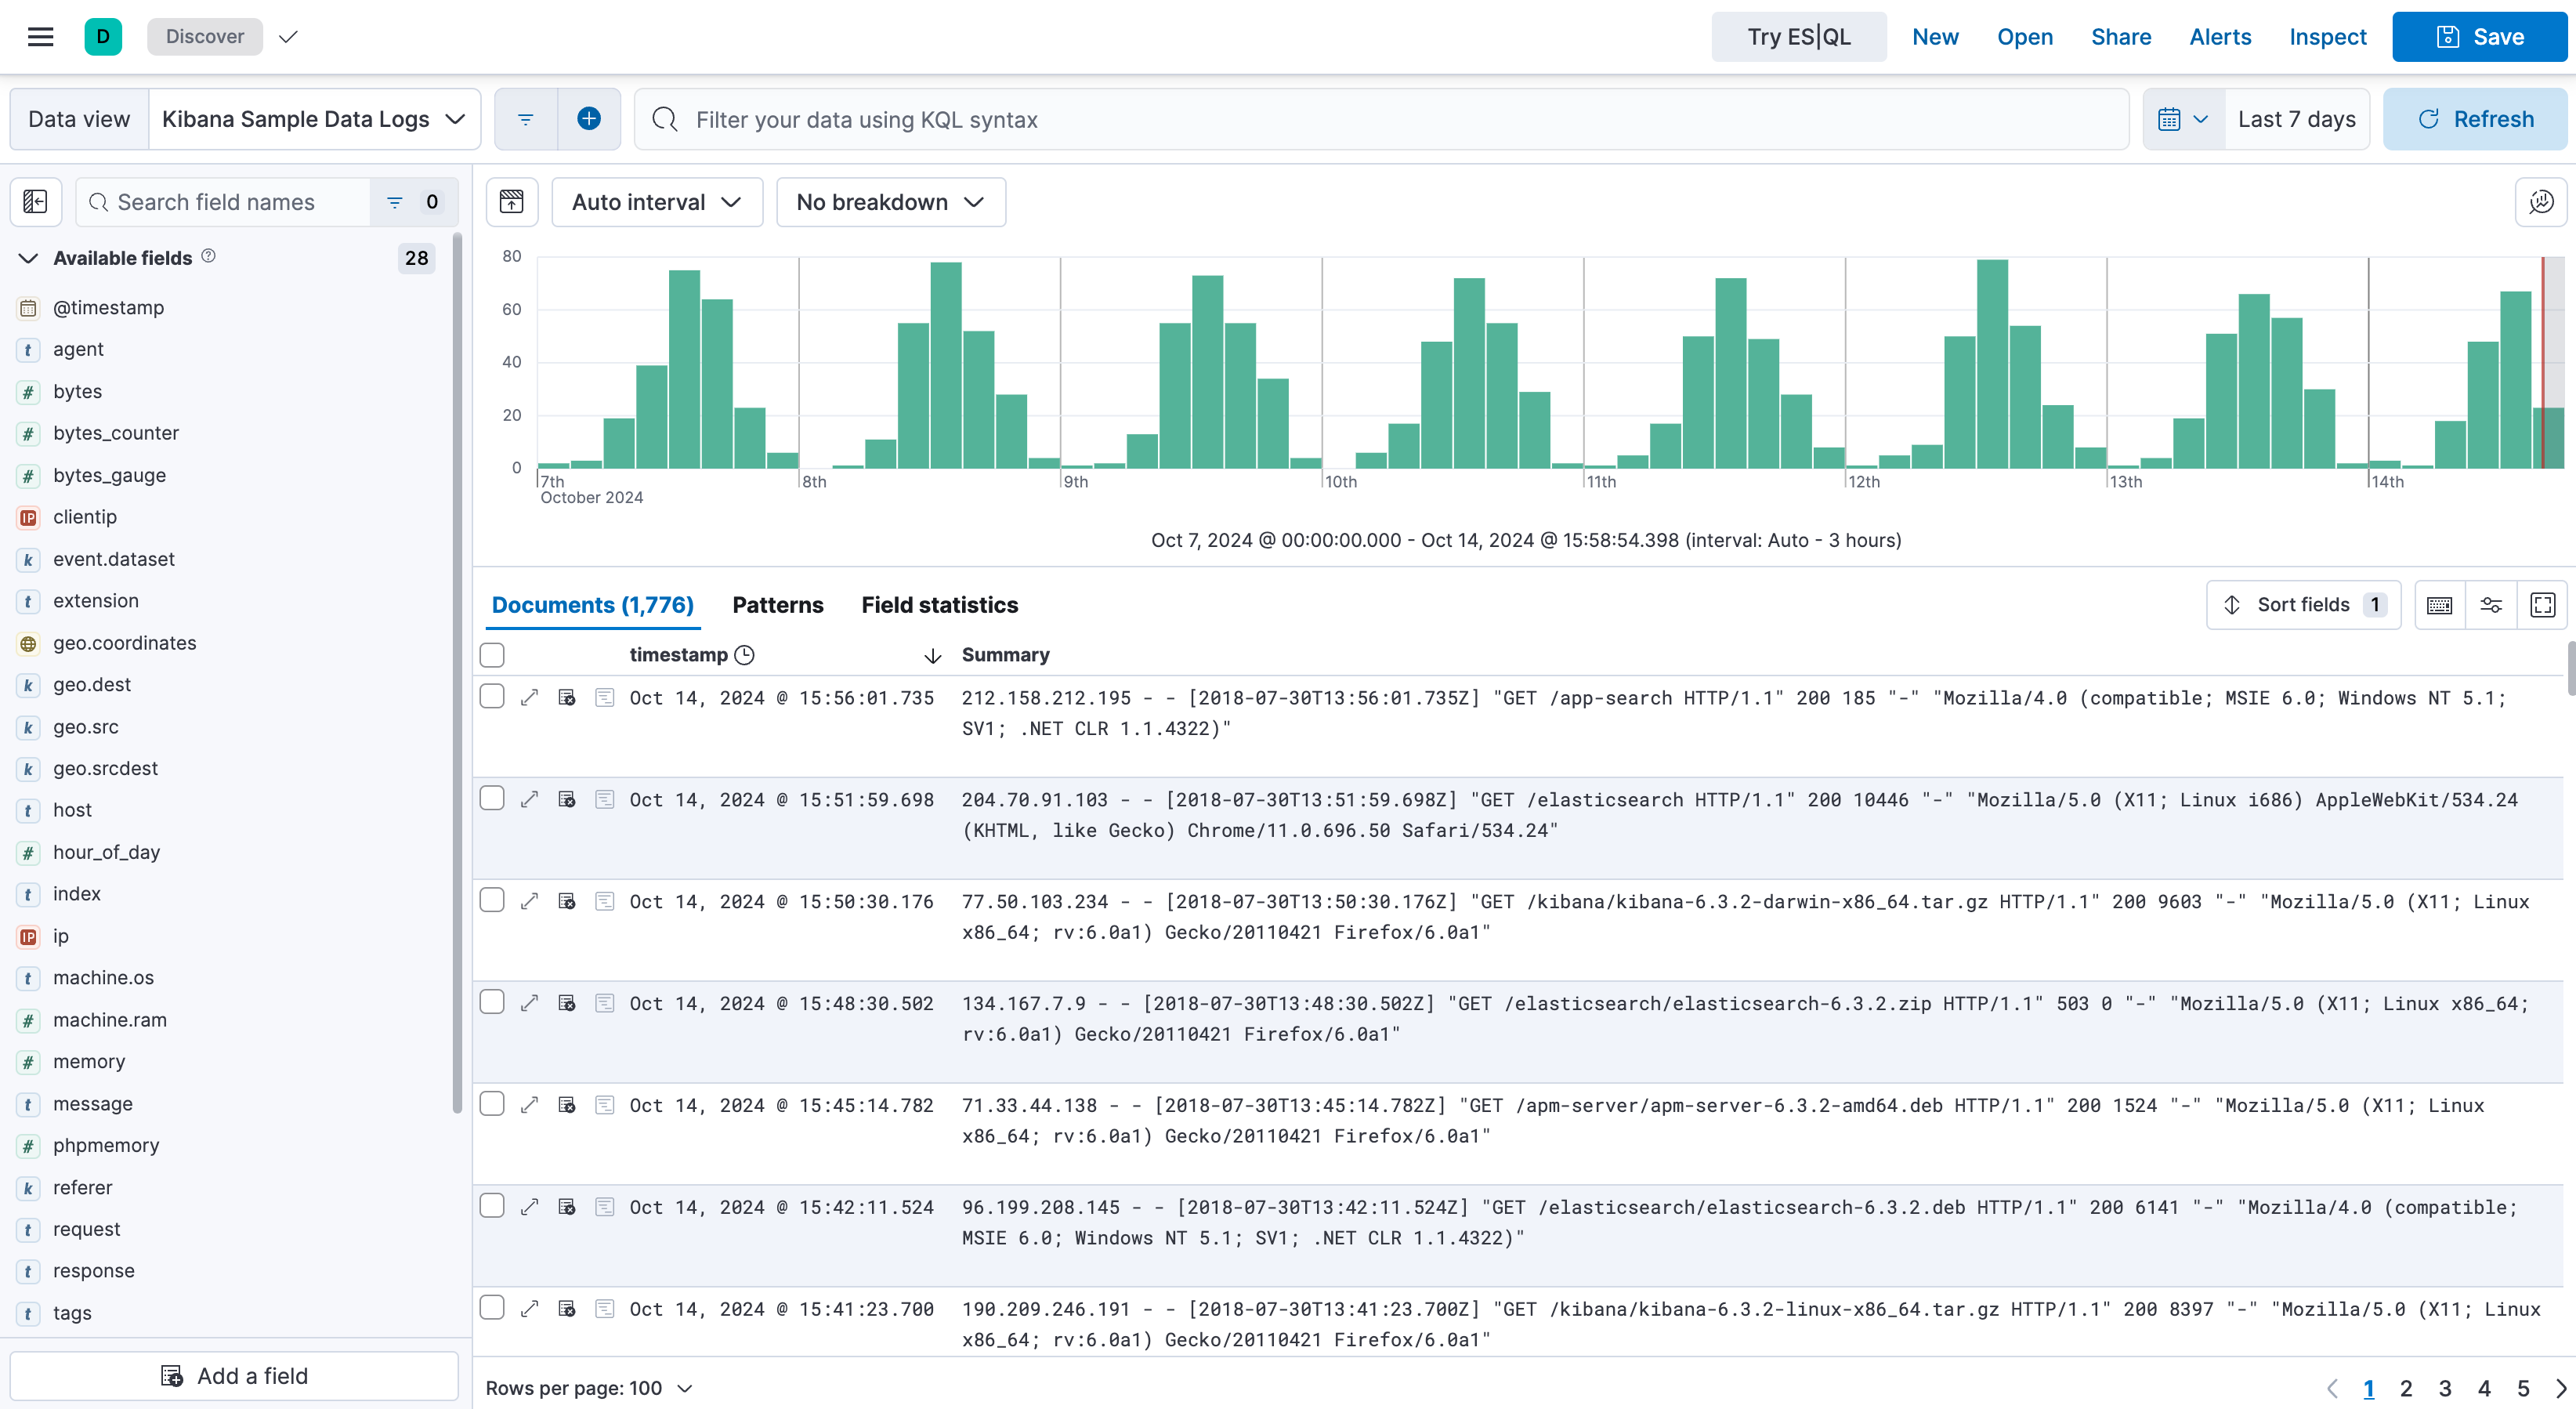
Discover lets you search and explore indexed data in detail. Use it to look at raw documents, check what they contain and see how your data changes over a selected time range. For a full description of every feature, see the official Elastic documentation on Discover.

Roles and Permissions

Depending on the role defined by the contract with your organization, you might have different permissions:

  • VIEWER: Read

  • EDITOR: Create, Read and Update

  • ADMIN: Create, Read and Update

With Discover you can:

  • view the list of documents, the fields they contain and the details of each document, field by field

  • see the trend over time in a histogram, together with the total number of matching documents

  • limit the analysis to a specific period with the time filter

  • search data with the search bar and narrow down the results with filters

  • sort results on one or more fields and choose which columns to show

  • choose the data view to work on

  • inspect the request sent to Elasticsearch and the response it returns

  • save searches to reuse later or to add to a dashboard

Data Views

A data view is a configuration that tells Kibana which subset of Elasticsearch data to use. It selects one or more indices or data streams and makes them available for analysis in Discover, Dashboards and Visualizations.

Every search in Discover runs on a single data view. To change it, open the data view selector in the top-left corner of Discover and pick a data view from the list. From the same menu you can also create a new data view by giving it a name and an index pattern that matches the indices or data streams you want to analyze.
Selecting a Data View

Fig. 224 Selecting a data view

Exploring your Data

Time filter

Use the time picker at the top of the page to set the period to analyze, either as a relative range (for example, the last 15 minutes) or as absolute start and end dates. Use the refresh button to run the search again and show the latest results.

Search bar and filters

Type a query in the search bar to find the documents you need. To narrow down the results, add filters next to the search bar, either on a specific field value or with a custom condition. Filters can be turned on and off, inverted or removed without changing the query.

Histogram and document count

Above the results, a histogram shows how matching documents are spread over the selected time range, together with the total number of hits. Select a bar or drag across the chart to zoom into a shorter period.

Document list

The main table lists the documents that match the current query, filters and time range. Expand a document to see all its fields and values.

Field list

The sidebar on the left lists the fields available in the selected data view. From here you can:

  • add a field to the table as a column, or remove it

  • look at the most common values of a field

  • filter for or against a specific value

Sorting and columns

Sort the results on one or more fields from the column headers, and rearrange or remove columns to show only the information you need.

Saving, Sharing and Inspecting Searches

The toolbar at the top of Discover lets you:

  • Open an existing saved search

  • Save the current search, including the query, filters, selected columns and sorting, so you can reuse it later or add it to a dashboard

  • Share the search with other users

  • Inspect the search to see the request sent to Elasticsearch and the response it returned, which helps when troubleshooting unexpected results

Note

Saving, updating and sharing searches requires the EDITOR or ADMIN role. VIEWER users can open and run existing saved searches.

Further reading: Discover in the Elastic documentation.
