


 ELK - Log Analytics
Dashboards
Dashboards let you view and organize multiple visualizations in a single place. You can combine charts, tables, metrics and filters into one view, which makes it easier to monitor your data and see the most important information at a glance. For a full description of every feature, see the official Elastic documentation on Dashboards.
Roles and Permissions
Depending on the role defined by the contract with your organization, you might have different permissions:
VIEWER: Read
EDITOR: Create, Read, Update and Delete
ADMIN: Create, Read, Update and Delete
The search bar, filters and time interval work the same way in Dashboards as in Discover (see Discover).
When you open the Dashboards menu, you can see the list of existing dashboards. From there you can open a dashboard or create a new one.
Create a Dashboard
Click Create dashboard to open a new, empty dashboard:
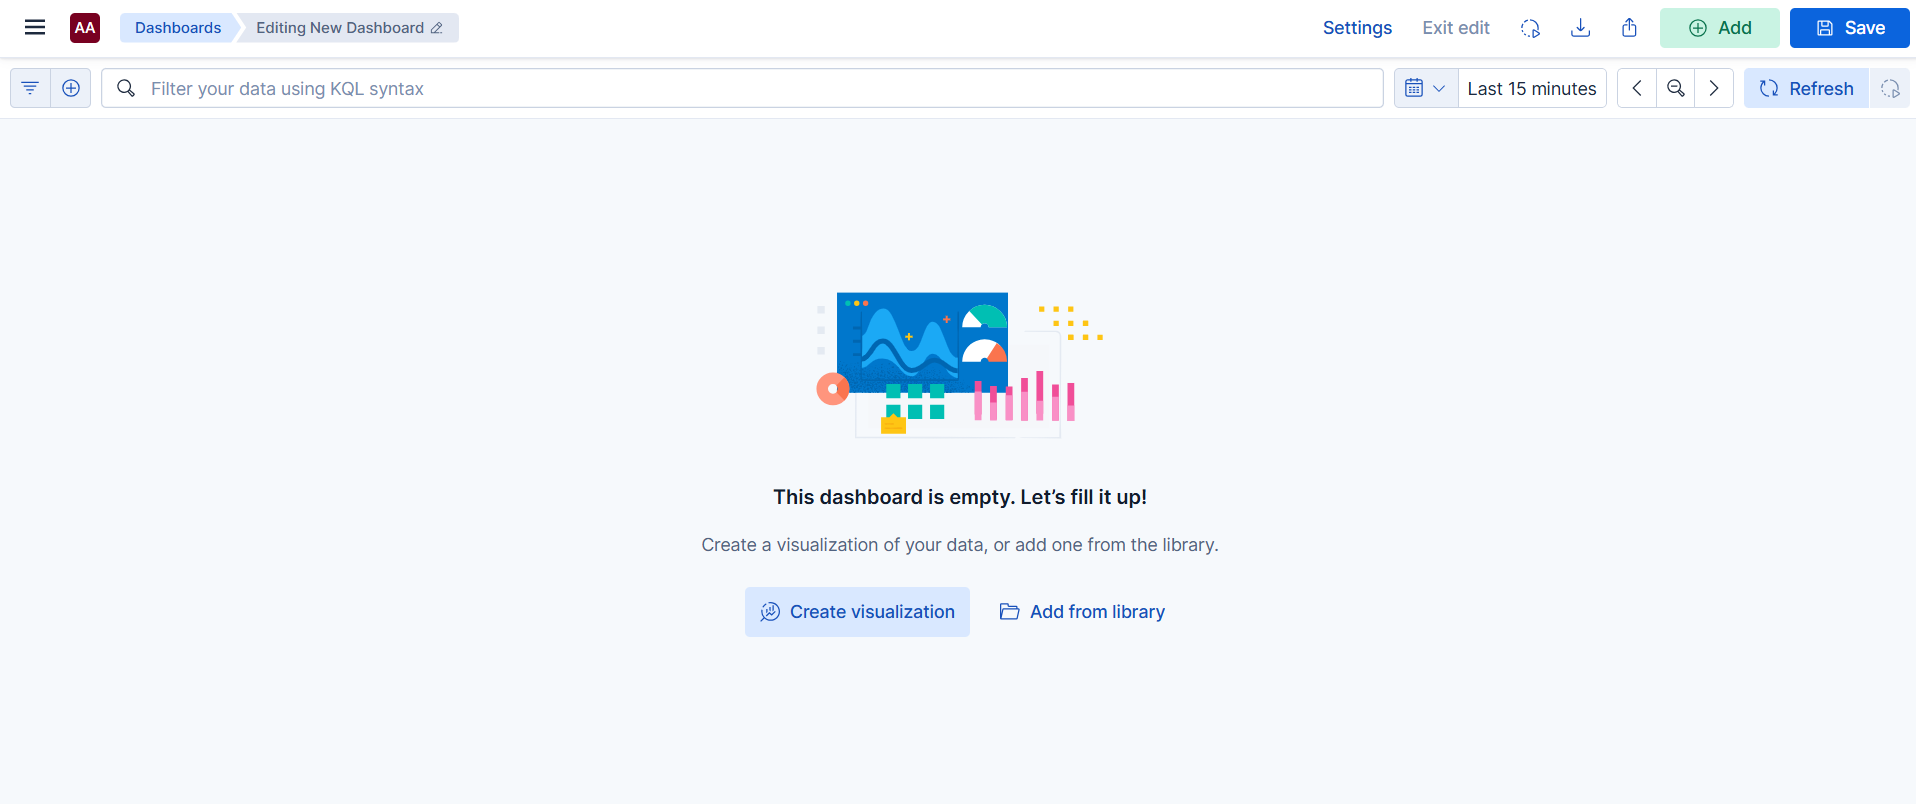
Fig. 225 Creating a new dashboard
Click Save to save the dashboard. You can also choose whether to store the current time interval with it.
Click Settings to change the dashboard settings, including the title, description and tags.
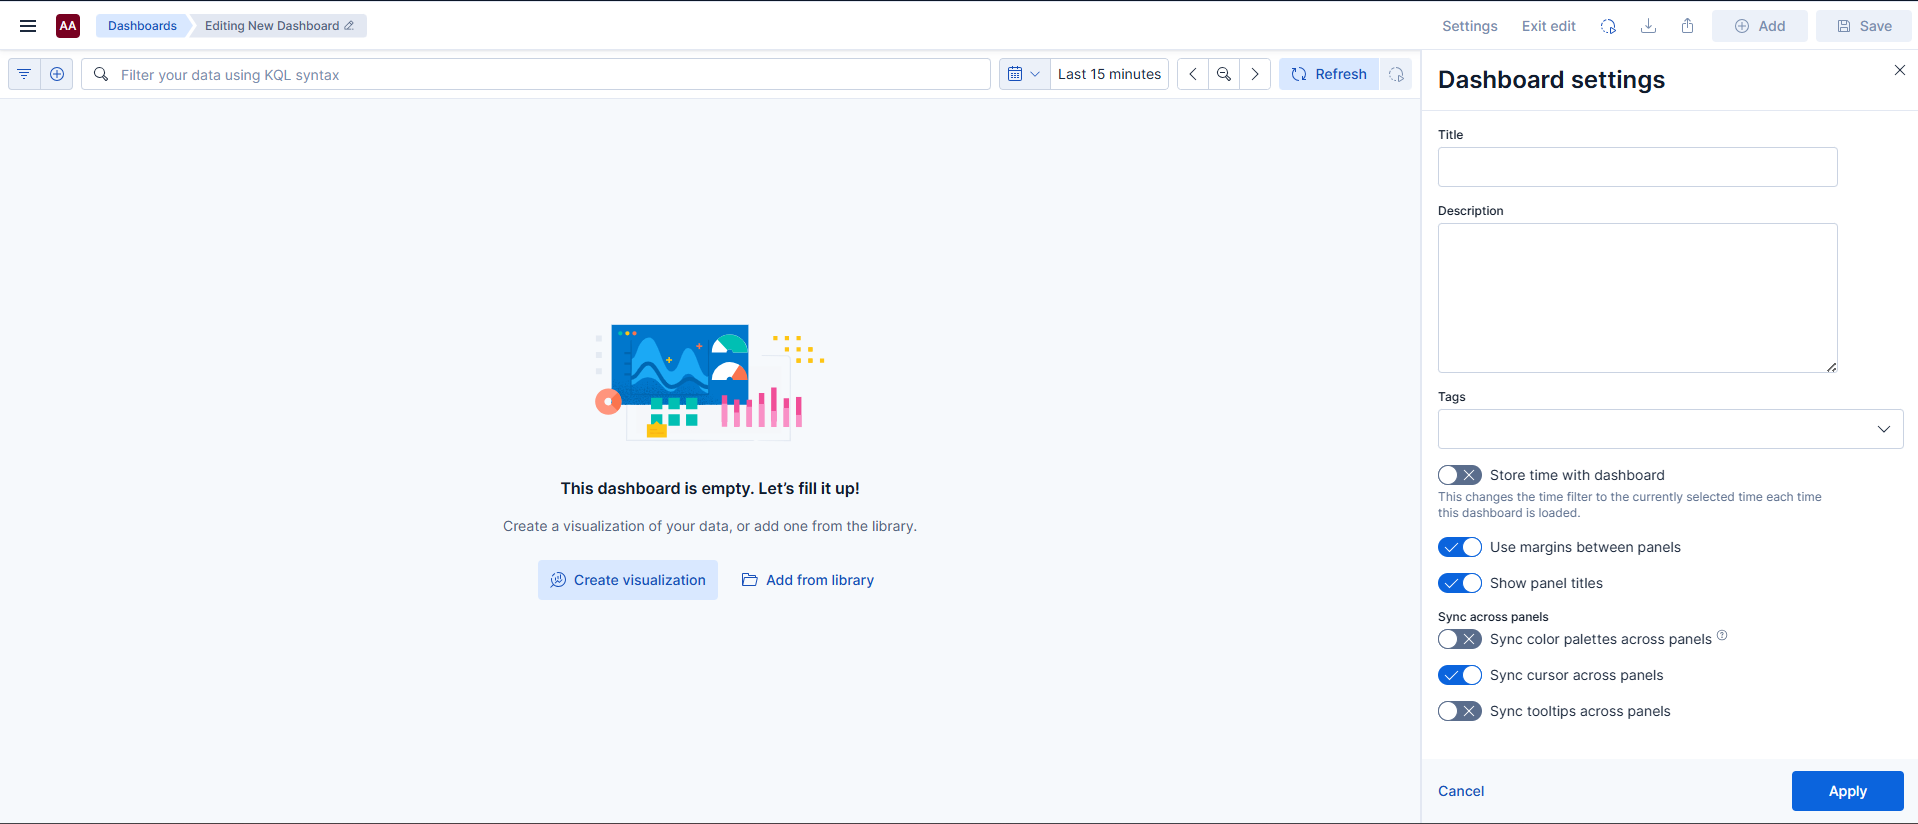
Fig. 226 Dashboard settings
Add Visualizations to a Dashboard
You can add a visualization to a dashboard in two ways:
Click Visualization to create a new visualization with Lens.
Click From library to add a visualization you created earlier.
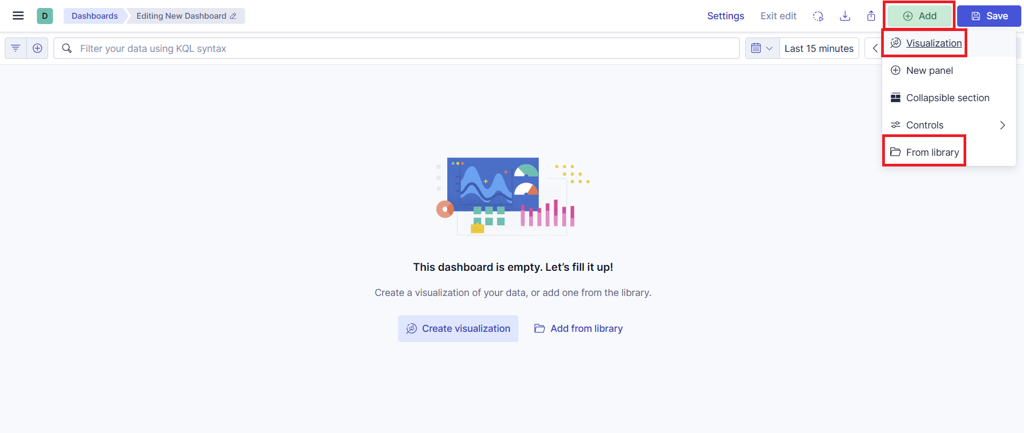
Fig. 227 Adding a visualization
Add Controls to a Dashboard
Controls are interactive filters that refine the data shown in a dashboard’s visualizations. You can use them to select values, define ranges or apply conditions directly from the dashboard. This lets you explore data without changing each chart one by one.
To add a control:
Click Add and then Controls:
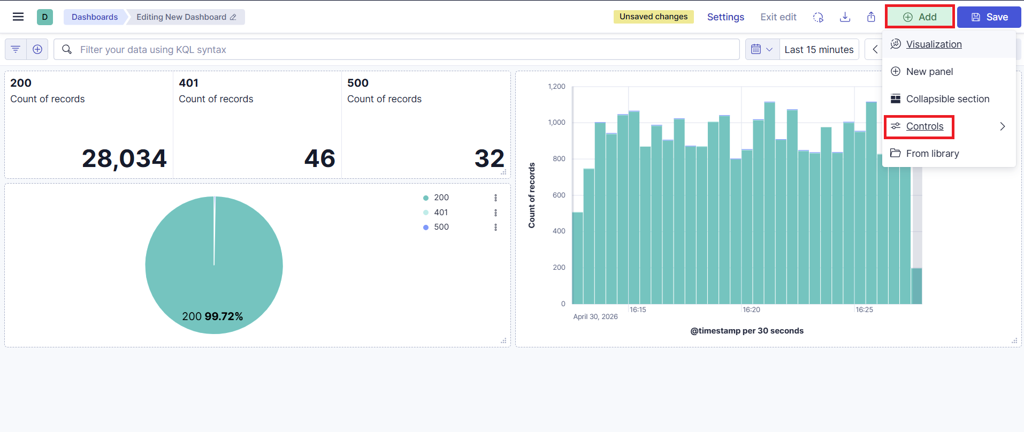
Fig. 228 Adding controls
Click the Control button:
Choose:
the data view
the field
the label to show in the dashboard
the type of control (list of values or numeric range)
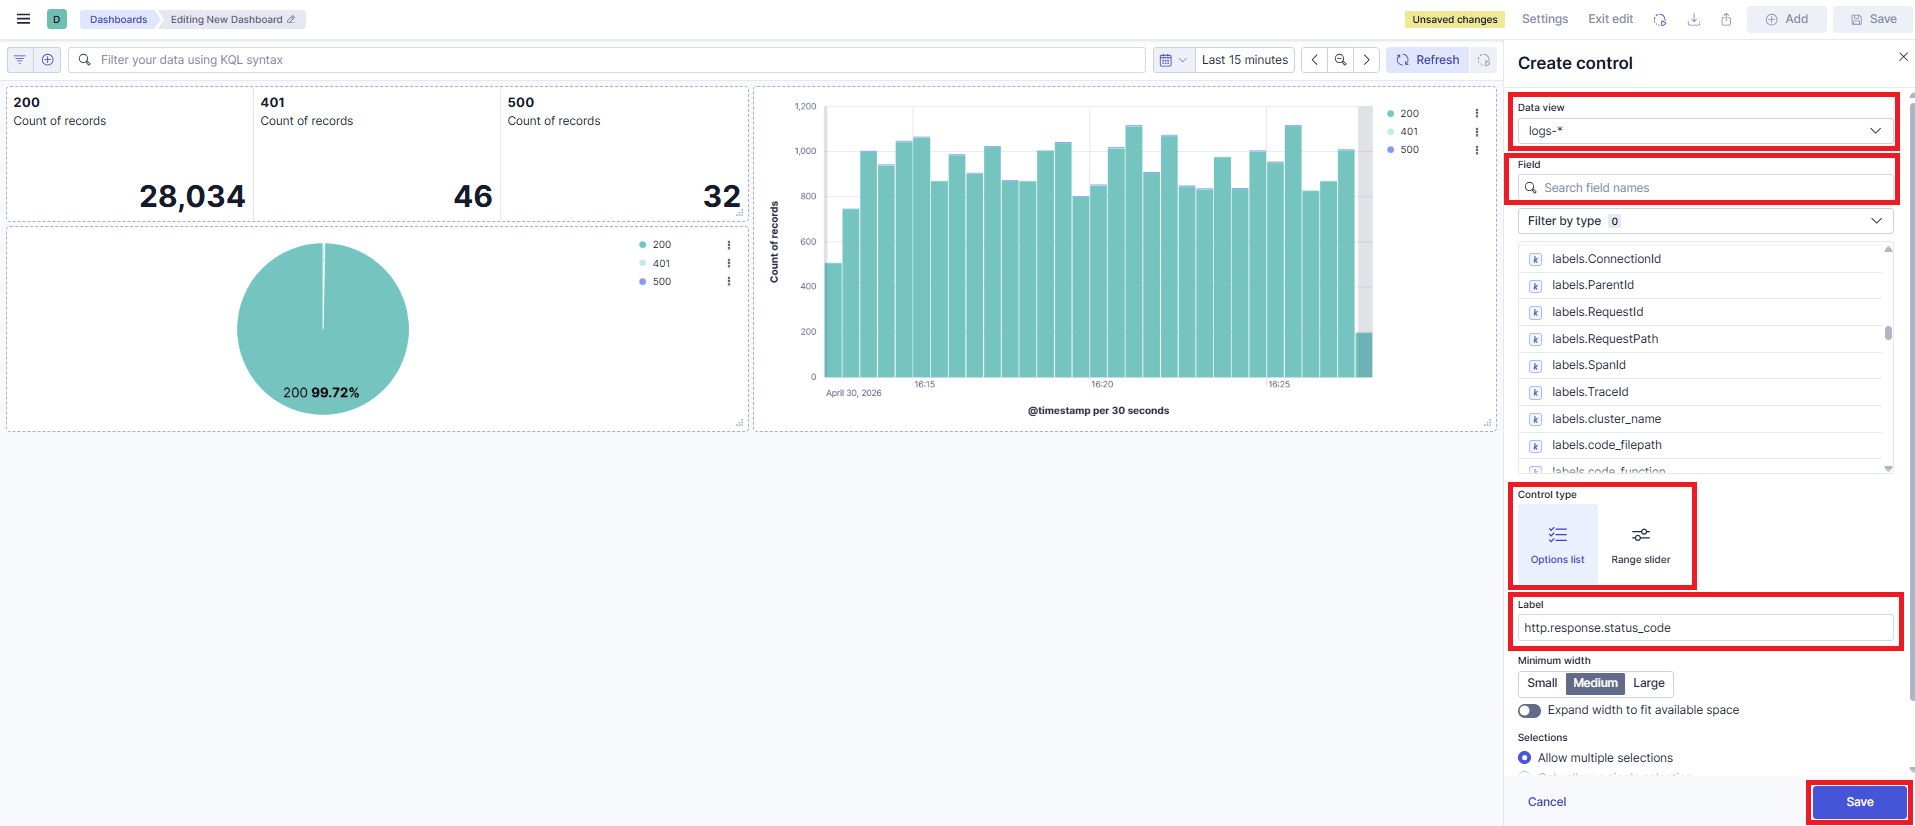
Fig. 229 Choosing control settings
Click Save. The control appears in the dashboard:
Further reading: Dashboards in the Elastic documentation.

