


 ELK - Log Analytics
Observability Overview
In NetEye.Cloud, Observability extends traditional monitoring by providing real-time visibility into the health, performance and behavior of complex, distributed environments. Powered by the Elastic Stack, it unifies separate telemetry streams into a single operational view, allowing you to move from detecting symptoms to identifying the root cause of an issue.
While Analytics focuses on exploratory search, data visualization and reporting, Observability provides purpose-built workflows centered around system reliability and service health.
NetEye.Cloud Observability correlates three fundamental data types across infrastructure and applications:
Logs: timestamped records of discrete events emitted by systems, containers and applications. Logs are unscheduled: an entry is written whenever something happens. They’re used for forensic analysis and real-time troubleshooting.
Metrics: numerical time-series data measuring resource utilization and performance indicators (such as CPU, memory, latency and throughput). Unlike logs, metrics are the result of regular, planned checks: values are collected at fixed intervals, which makes them suitable for detecting trends and capacity issues.
Traces (APM): end-to-end transaction journeys through distributed services that pinpoint latency bottlenecks, errors and failure points in application code.
The Observability module integrates these telemetry sources into unified workflows:
- Infrastructure Monitoring
Track the operational status and resource consumption of hosts, containers and cloud services.
- Application Performance Monitoring (APM)
Instrument services to trace user requests, map service dependencies and profile performance.
- Uptime & Synthetic Monitoring
Proactively probe network endpoints and critical user journeys to verify availability from external viewpoints.
- Alerting & Rule Management
Configure dynamic rules across logs, metrics and thresholds to detect anomalies and trigger automated notifications before incidents impact users.
The primary value of the Observability interface is context-preserving correlation. When investigating an anomaly, such as a sudden spike in service latency, you can pivot seamlessly from an infrastructure metric alert directly into the relevant application traces and container logs from the exact same timeframe without losing search context.
Let’s say it’s 09:42 and an alert fires: the average response time of the
payment-service has been above 1.5 seconds for the last five minutes.
You open it in Alerts and notice that only the production environment
is affected and that no other alert is active, so whatever is happening is
limited to this one service.
From the alert you jump straight to the service in Applications, with the time range already set around the incident. The latency chart shows the spike starting at 09:37, and the transaction breakdown makes it clear that the extra time is spent waiting for the database, not in the application code. So you follow the dependency to the host that runs the database in Infrastructure. Its metrics tell the rest of the story: disk I/O has been at 100% since 09:35. Because metrics are collected at regular intervals, the saturation was recorded two minutes before anyone noticed a slow checkout.
That leaves the question of why the disk is saturated. In Logs, still on the same host and the same time range, the entries written at 09:35 show a scheduled backup job starting. Symptom found, cause found, and at no point did you have to rebuild the search or re-enter the time range.
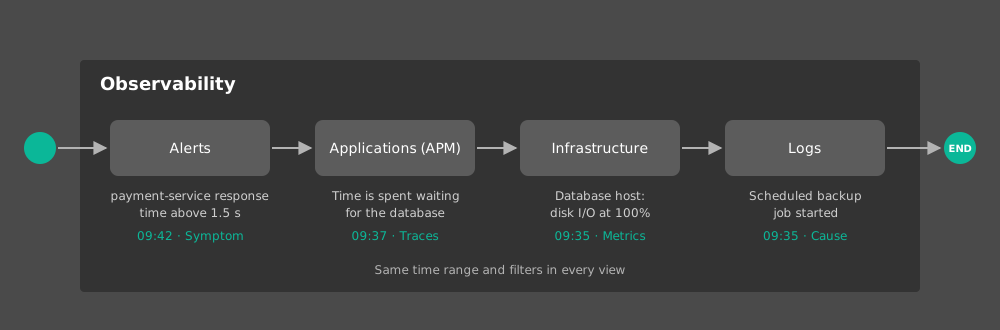
Fig. 232 From symptom to cause: the same time range and filters follow you from one Observability application to the next.
The following chapters describe the dedicated interfaces, configuration steps and common operational workflows for each Observability application.

