


 ELK - Log Analytics
Alerts
The Alerts section allows you to monitor, investigate and manage alerts generated across your infrastructure, applications and logs. It provides a centralized operational view to identify abnormal conditions, assess their severity and initiate troubleshooting workflows before end users are impacted.
Key capabilities include:
Real-time alert triage: review active and resolved alerts, filtered by severity, status and time range.
Root-cause investigation: trace an alert back to the exact telemetry, metric spike or log entry that triggered the condition.
Rule administration: maintain and fine-tune detection logic, evaluation schedules and notification channels.
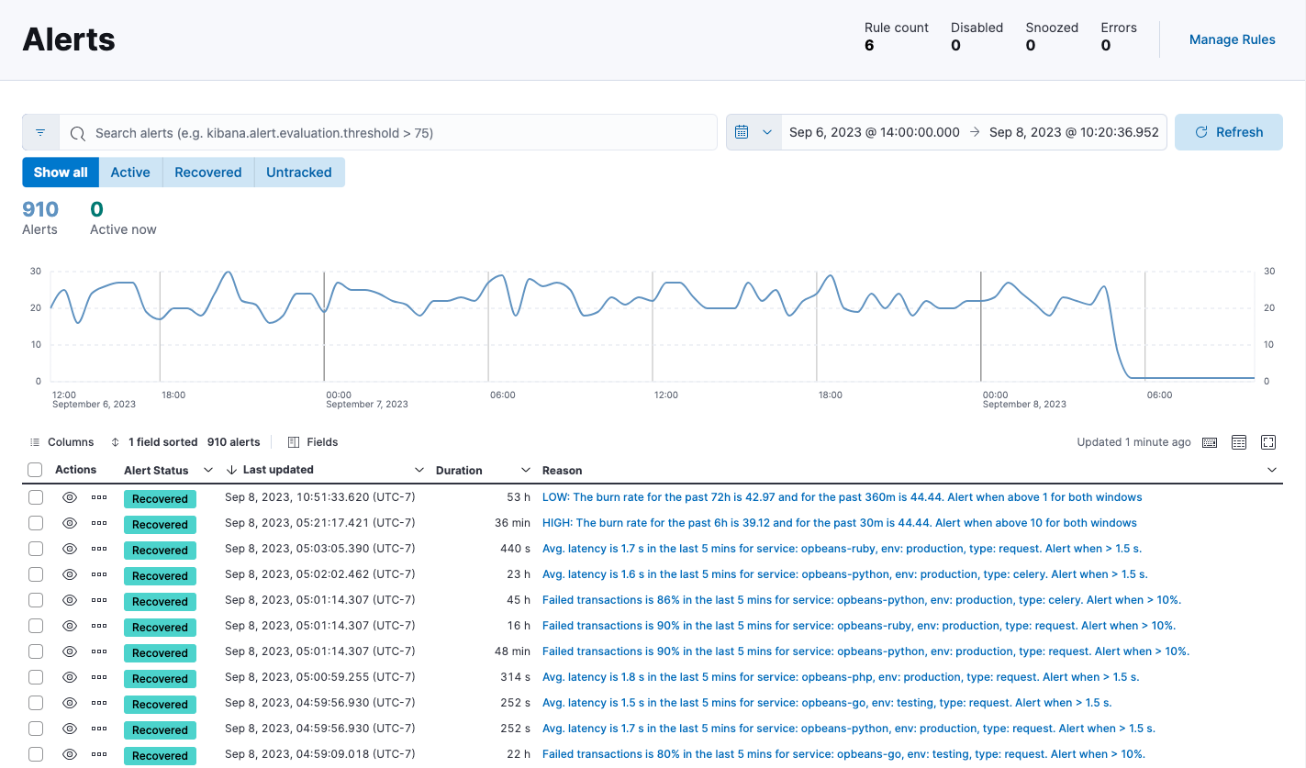
The Alerts page lists all alerts in the selected time range. Use the Show all, Active, Recovered and Untracked tabs to filter them by status, and the search bar to filter by any alert field. The chart shows how alerts are distributed over time, and the table below it gives the status, duration and reason of each alert. The counters in the top right summarize the rules in your environment; click Manage Rules to open the list of rules.
Roles and Permissions
Depending on the role defined by the contract with your organization, you might have different permissions:
Alert rules
VIEWER: Read-only access to triggered alerts and rule configurations
EDITOR and ADMIN: Create, edit, enable/disable and delete rules
Action connectors
VIEWER and EDITOR: Read-only access to configured connectors
ADMIN: Create, update and delete third-party integrations and notification endpoints
Create and Manage Rules
Alert rules continuously evaluate data streams against predefined conditions.
You can manage existing rules from the global Rules view to adjust thresholds, modify evaluation intervals or mute noisy alerts. The view lists every rule with its type, last run, last response and state, and lets you enable, disable, edit or delete rules. Click Create rule to define a new one.
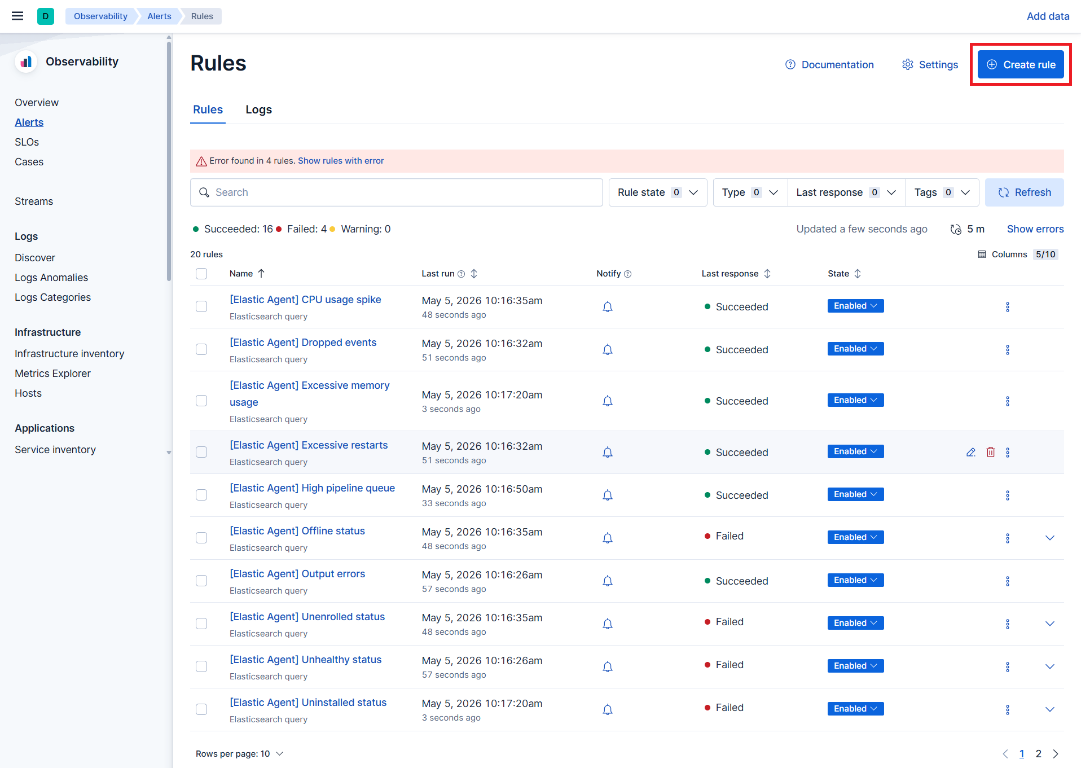
When creating a new rule, the configuration workflow consists of three primary stages:
Conditions & scope: select the rule type (for example metric threshold, log pattern or anomaly detection), target data sources, query filters and trigger criteria.
Evaluation schedule: define the check frequency (how often the rule executes) and the evaluation window (the look-back period).
Actions & frequency: assign one or more connectors to trigger notifications or ticketing workflows, specifying whether actions fire on every execution, on status change or when the condition is resolved.
For more details, see the official Elastic documentation on creating and managing rules.
Note
Contextual alert creation
Alert rules don’t need to be built exclusively from the dedicated Alerts menu. When analyzing services in APM, inspecting nodes in Infrastructure or querying logs in Discover, you can create rules directly from the current view. The rule creation wizard automatically inherits the filters, service scope and metrics of your active session. For an overview of these applications, see Observability; both examples at the end of this chapter create their rules this way, starting from the APM service inventory.
Connectors
Connectors integrate NetEye.Cloud alerting with external communication and incident management platforms. Rather than merely recording an alert in the UI, connectors automate immediate operational handoffs.
Supported destinations include:
Email & webhooks: custom HTTP payloads and SMTP notifications.
Chat platforms: instant messaging channels (for example Microsoft Teams or Slack).
Ticketing systems: automated incident or issue generation (for example Jira or ServiceNow).
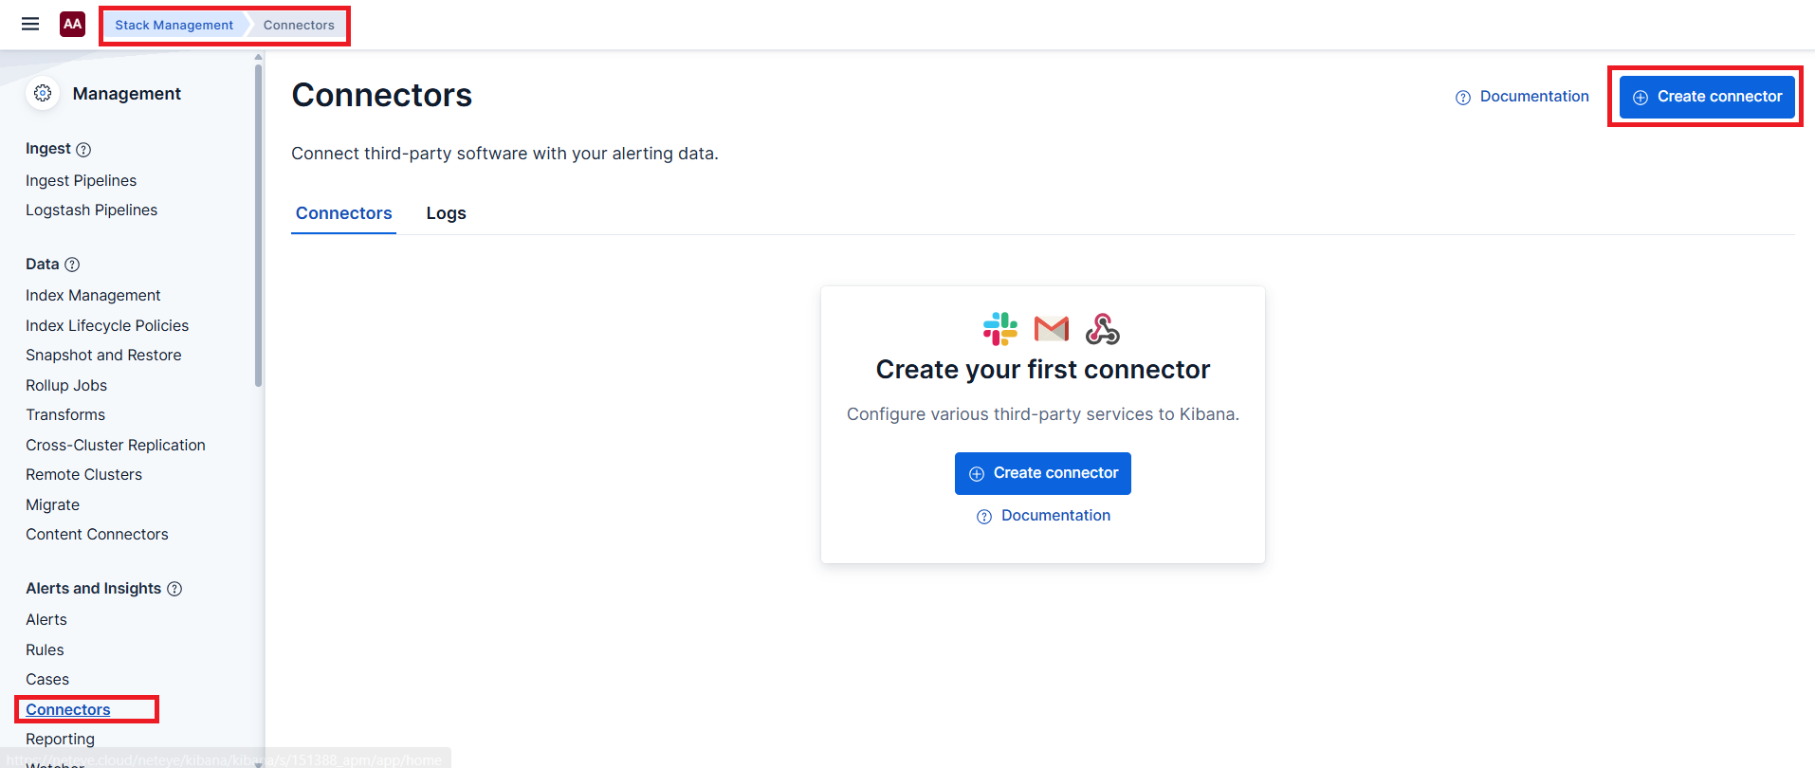
Connectors are managed in . Click Create connector to add a new destination. Configuration parameters (such as API tokens, endpoints and credentials) are managed centrally by administrators to ensure secure and reusable channel definitions across multiple alert rules.
The following examples illustrate the two primary detection paradigms available in NetEye.Cloud.
Example 1: Service Latency Threshold (Static Rule)
Use threshold rules when you have clear, predefined Service Level Objectives (SLOs):
Navigate to , select the target service and click .
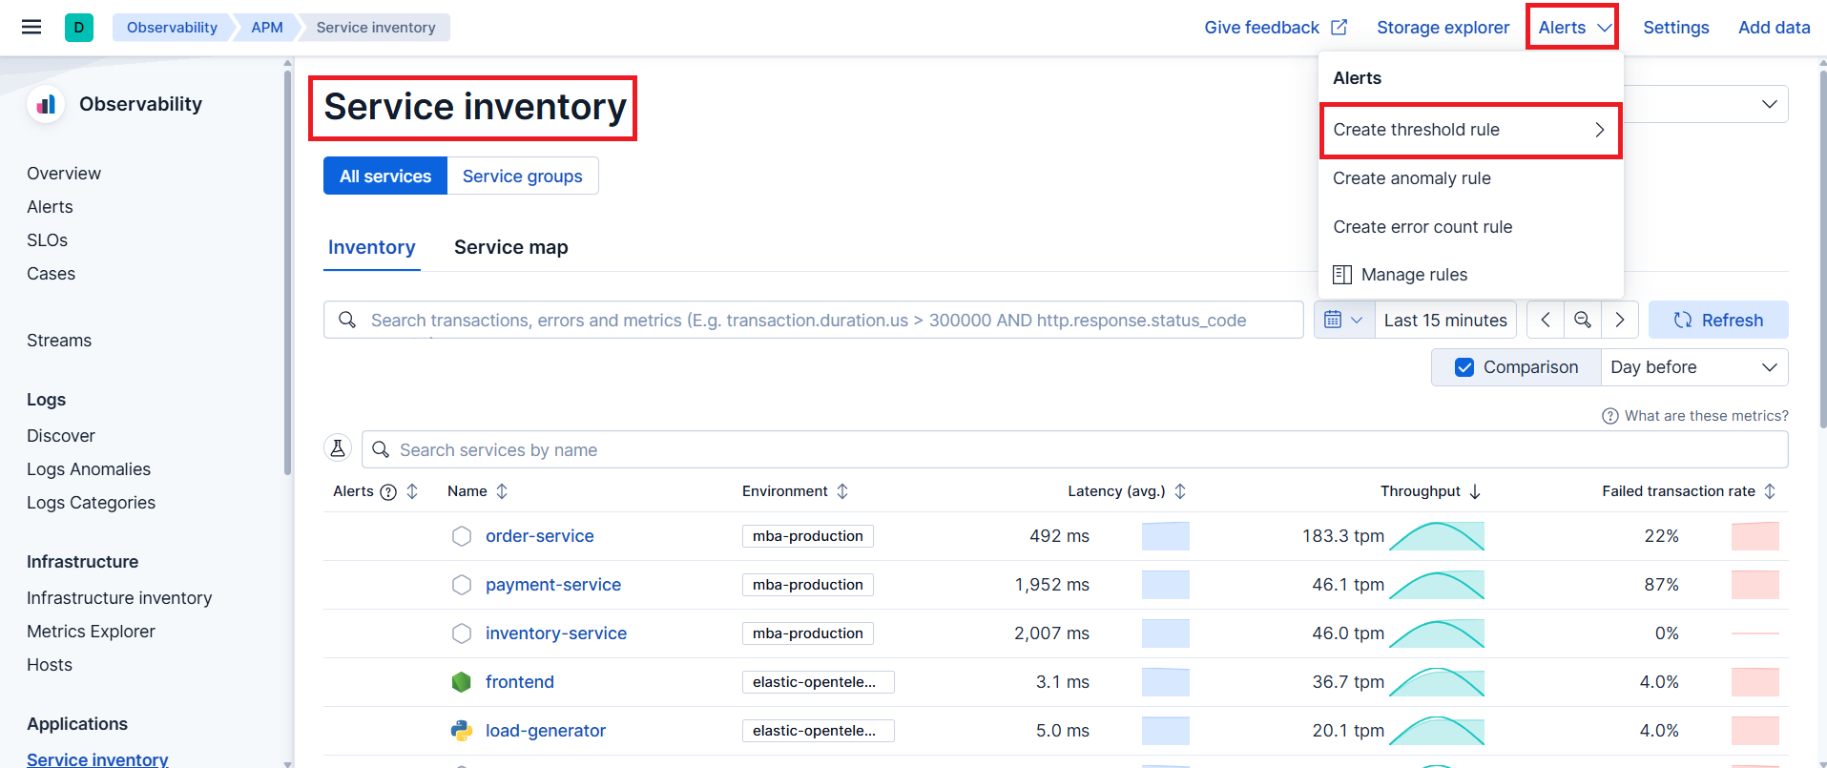
Define conditions: the Create rule wizard opens on the Definition step. Specify the service, transaction type (for example
request) and environment, and set the latency criteria (for example average latency is above 1500 ms for the last 5 minutes). In Group alerts by choose the fields that produce separate alerts, and in Rule schedule set how often the conditions are checked. Click Next.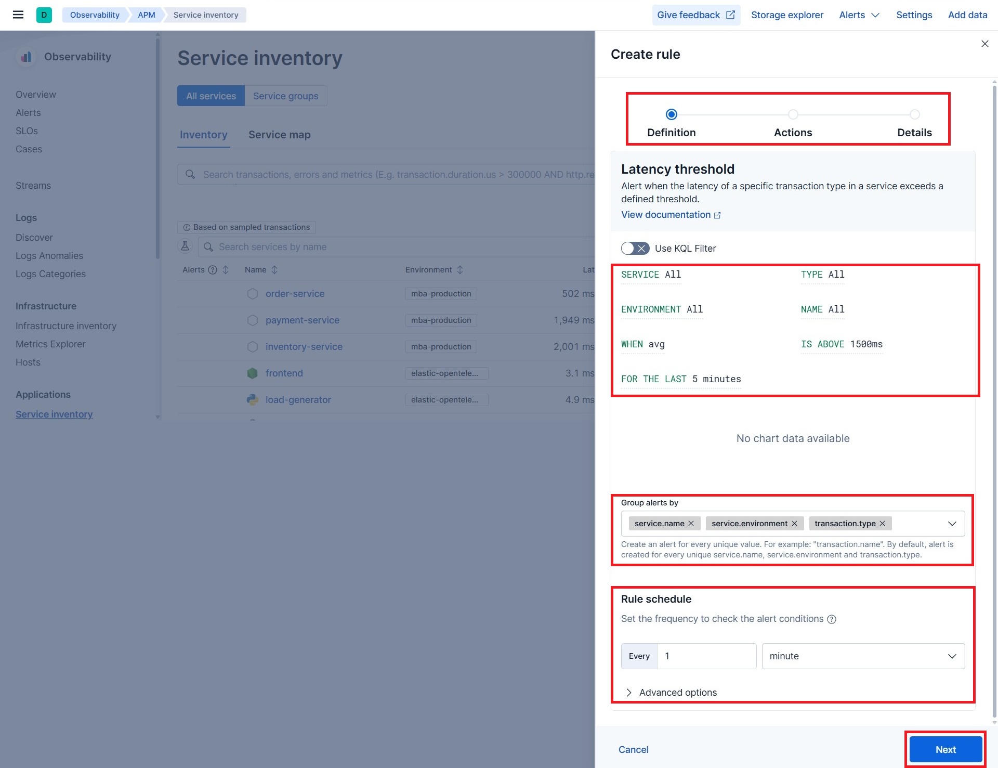
Configure action: in the Actions step, select an existing notification connector (for example Teams Operations Channel) and set the notification frequency to On status change.
Save: in the Details step, assign a descriptive rule name (for example
[Prod] Web Service Latency Warning), add tags if needed and save the rule.
Example 2: Service Performance Anomaly (Machine Learning Rule)
Use anomaly detection rules when baseline behavior fluctuates naturally (for example cyclical traffic patterns) and static thresholds would produce false positives:
In , select the target service and click .
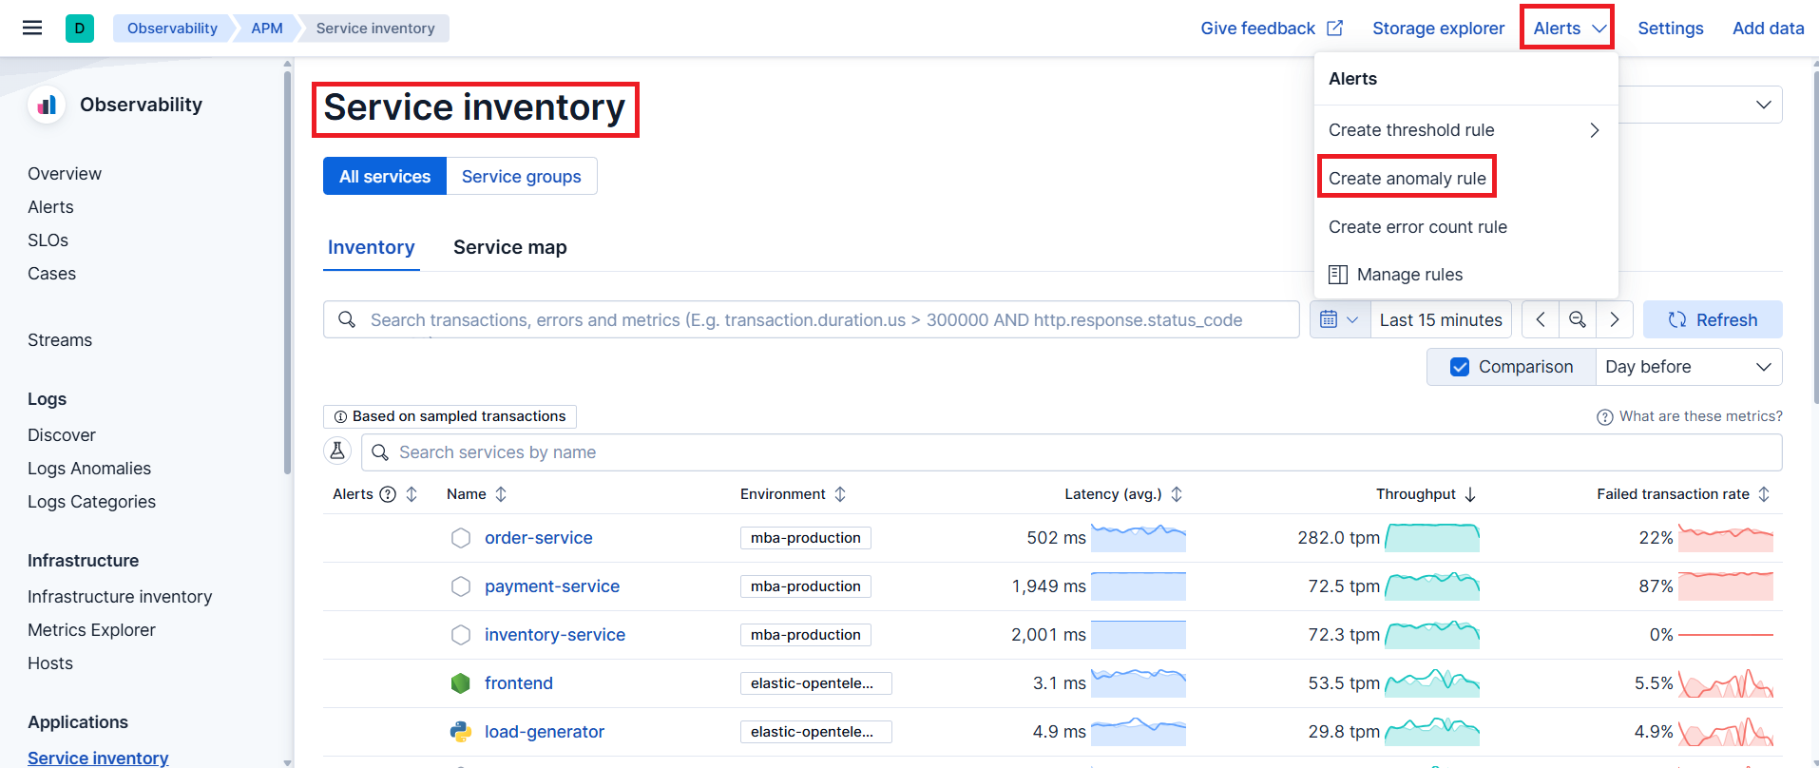
Define scope: select the target metric to analyze (for example High Latency, Failure Rate or Throughput Drop).
Set sensitivity: choose the anomaly score threshold (for example Warning for moderate deviations, Critical for severe deviations). The underlying ML model evaluates current behavior against learned historical baselines rather than a hard numerical limit.
Attach action & details: add your notification connector and finalize the rule metadata.

