


 ELK - Log Analytics
Service Level Objectives (SLOs)
The SLOs section is where you define reliability targets for your services and check whether they’re being met. Alerts tell you about individual incidents; an SLO tells you how a service has performed over a period against a target you agreed on, such as “99.5% of checkout requests succeed” or “99% of page loads complete within 300 ms”. This turns a service level agreement or an internal goal into a single, continuously evaluated number you can act on and report.
How an SLO is Built
Every SLO comes down to three decisions. Make them before you open the wizard and the setup will be straightforward.
What to measure. The service level indicator (SLI) is the proportion of good events out of all events. Good can mean a successful HTTP response, a transaction under a latency threshold, a synthetic check that returned up, or any condition you can express as a query.
How good is good enough. The target is a percentage, for example
99.5%. What’s left (100% - target) is the error budget: the share of
events allowed to be bad before the SLO is breached.
Over which period. A rolling time window (for example the last 30 days) always looks back from now and suits day-to-day operations. A calendar aligned window (for example each month) resets on fixed dates and better matches contractual SLAs and periodic reporting.
Roles and Permissions
Depending on the role defined by the contract with your organization, you might have different permissions:
VIEWER: Read
EDITOR: Create, Read, Update and Delete
ADMIN: Create, Read, Update and Delete
Create an SLO
Open and click Create SLO (or Create new SLO if SLOs already exist). The wizard has three steps.
Define the SLI (service level indicator), that is, what counts as a good event and out of which total. From Choose the SLI type, pick the type that matches your data:
APM latency / APM availability: for services monitored with APM. Select the service, environment and optionally a transaction name; for latency, also the threshold in milliseconds.
Custom Query: for log or event documents. Select the data view and timestamp field, then write a Good query (for example
http.response.status_code < 500) and a Total query (for examplehttp.response.status_code : *).Custom Metric: like a Custom Query, but good and total are aggregations of numeric fields rather than document counts.
Histogram Metric: for values stored in histogram fields, typically latency distributions.
Timeslice Metric: for an equation over several aggregations evaluated per time slice; requires the Timeslices budgeting method described in the next step.
Synthetics availability: for the uptime of synthetic monitors, selected by name, project or tag.
Use Group by (for example on
service.name) to get one SLO per value of a field instead of a single aggregated one.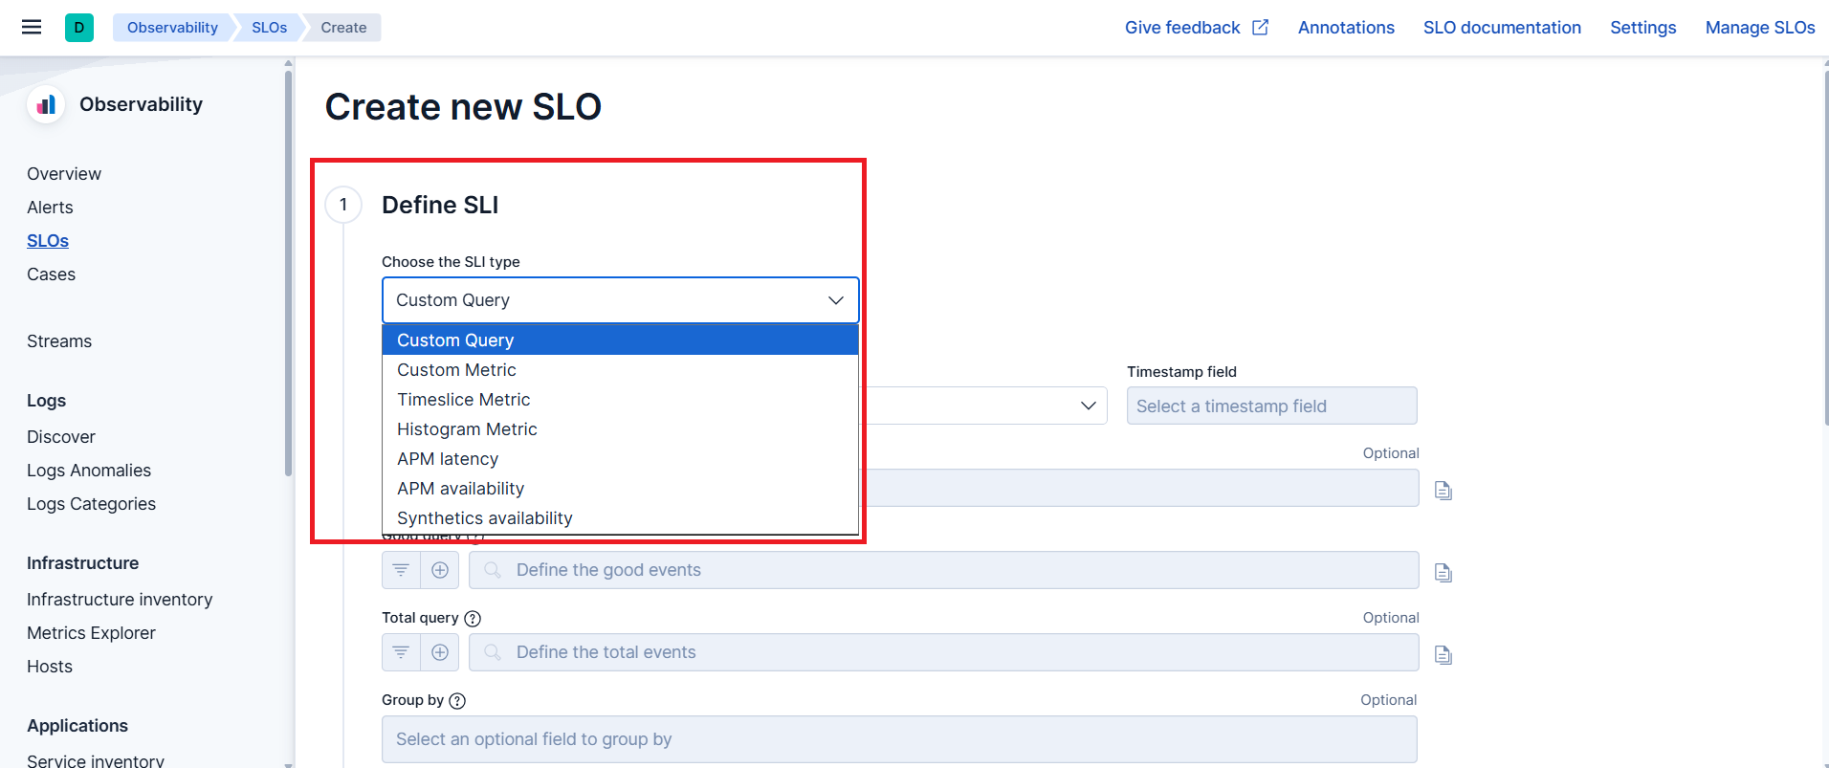
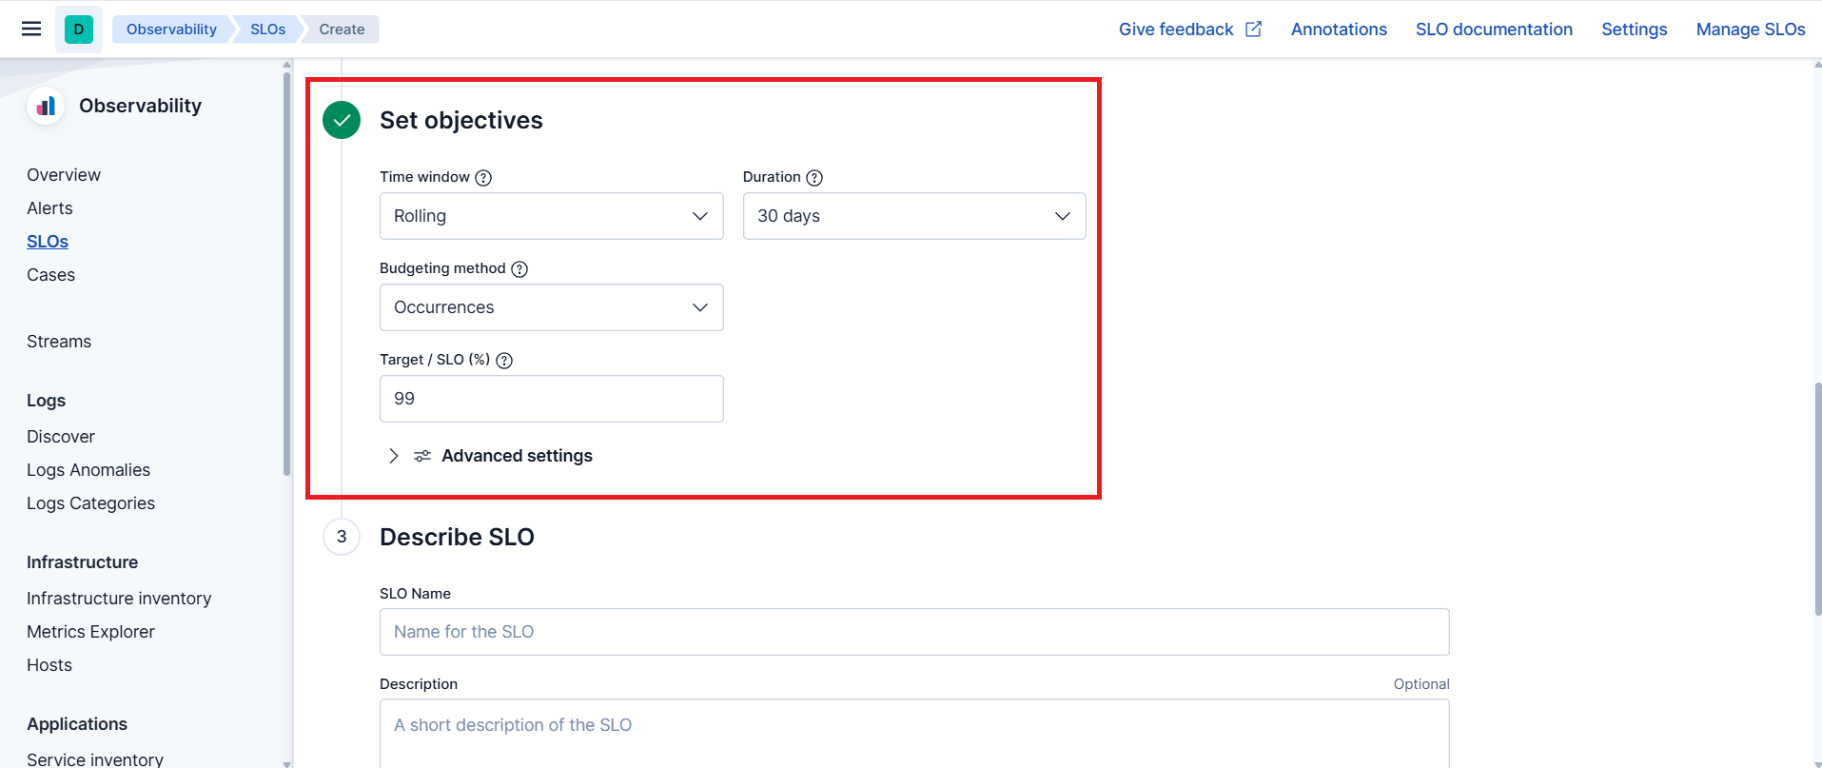
Set the objectives. Choose the Time window (rolling or calendar aligned) and its Duration, the Budgeting method and the Target / SLO (%). For the budgeting method, Occurrences counts good events against total events and is the usual choice; Timeslices splits the window into slices of fixed duration and counts good slices against total slices, so that a short outage weighs the same regardless of how much traffic it affected.
Describe the SLO. Give it an SLO Name that identifies the service and what is measured (for example
[Production] Checkout
availability
), a Description, and Tags such as environment or team for filtering later. Optionally pick Linked dashboards to reach related dashboards from the SLO. Click Create SLO.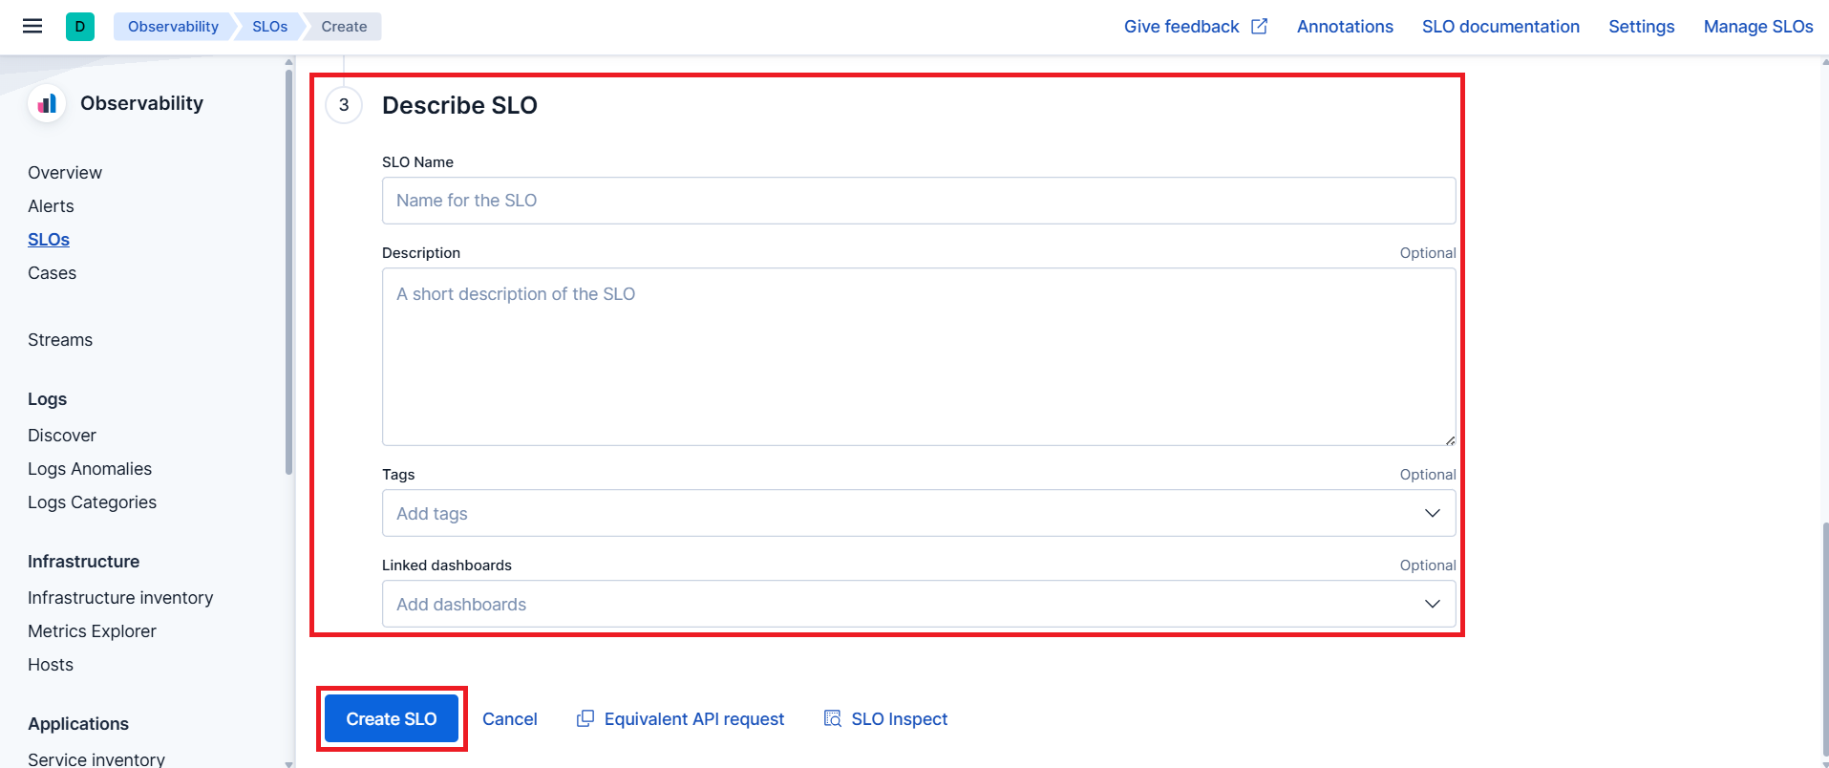
Note
The SLO is computed starting the moment it’s created. With a rolling 30-day window, status and error budget reflect a shorter period until 30 days of data are available.
Monitor your SLOs
The SLOs overview shows one card per SLO (or per group value). Use the Status and Tags filters and the search bar to narrow the list, and Sort by or Group by to organize it. Each card shows:
Status: Healthy if the observed SLI is at or above the target, Violated if below, or Degrading if the error budget is being consumed faster than planned. An alert badge appears if an alert is active for the SLO.
SLI type, tags and time window of the SLO.
Observed value: the current SLI percentage against the target, with its trend.
Budget remaining: how much of the error budget is left in the current window. A negative value means the budget is exhausted and the SLO is violated.
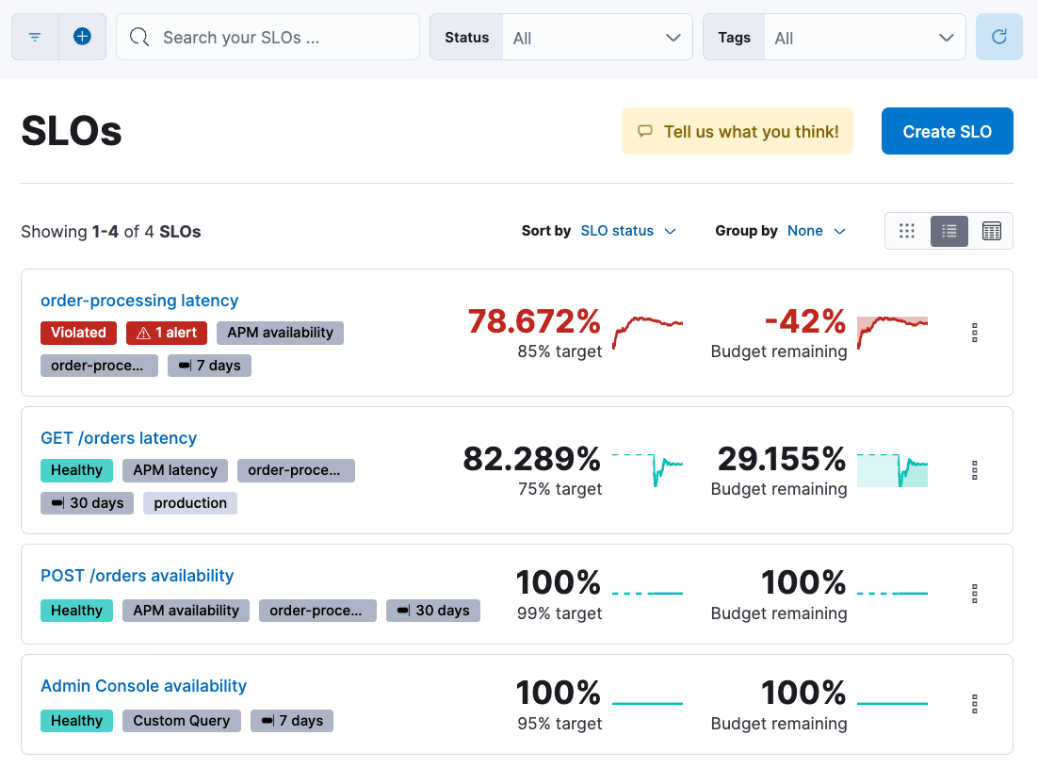
Click a card to open the SLO details, where you can follow the SLI and the error budget over time and edit or delete the SLO. To show an SLO next to other data, add an SLO Overview panel to a dashboard (see Dashboards).
Note
Instead of alerting only when an SLO target is breached, you can configure an SLO burn rate alert rule. It triggers when the error budget burns at an unsustainable rate, for example 10% of a 30-day budget in under an hour, so that you can address the degradation before the target is violated. See Alerts for rules and connectors.

