


 ELK - Log Analytics
Graph
Graph is used to explore and visualize relationships between data entities. Its purpose is to help users discover how different values, fields or documents are connected within the indexed data.
Instead of focusing only on counts, trends or charts, Graph highlights links and associations. This makes it useful for identifying patterns, dependencies and hidden relationships that may not be immediately visible through standard visualizations.
With Graph, users can:
explore connections between entities and values
identify related terms or linked data points
visually analyze how different elements are associated
expand the graph to discover additional relationships
support investigations and pattern analysis through a graphical view
Graph is especially useful when the goal is to understand how data elements are connected, rather than only measuring them.
Roles and Permissions
Depending on the role defined by the contract with your organization, you might have different permissions:
VIEWER: Read
EDITOR: Create, Read, Update and Delete
ADMIN: Create, Read, Update and Delete
Creating a Graph
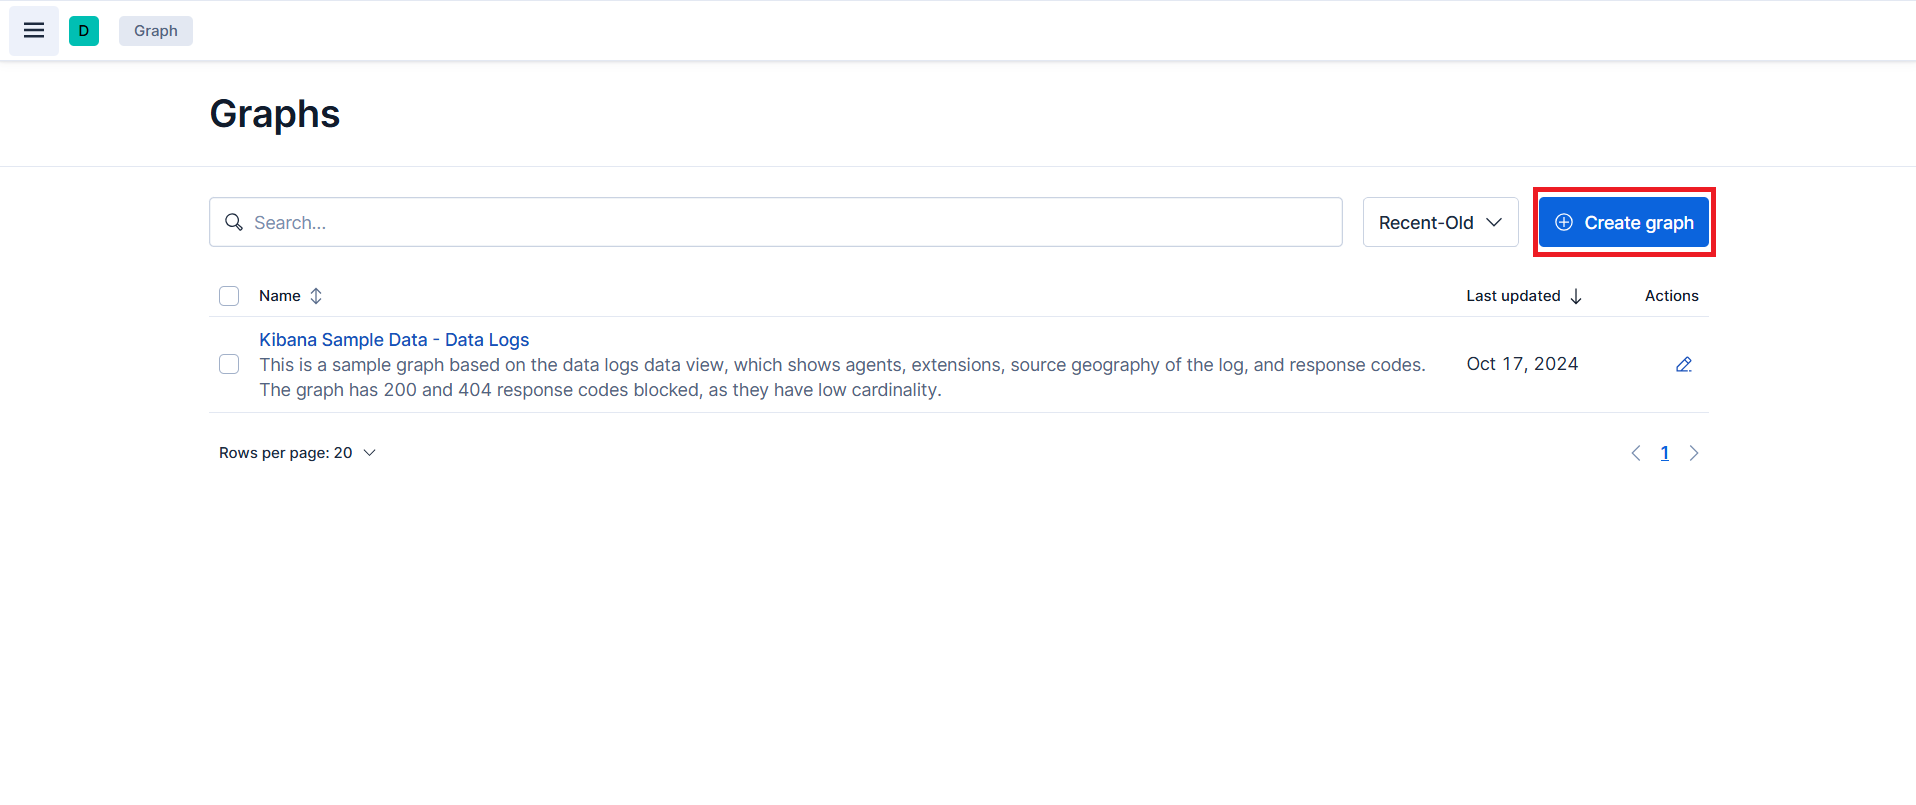
Click the Create graph button.
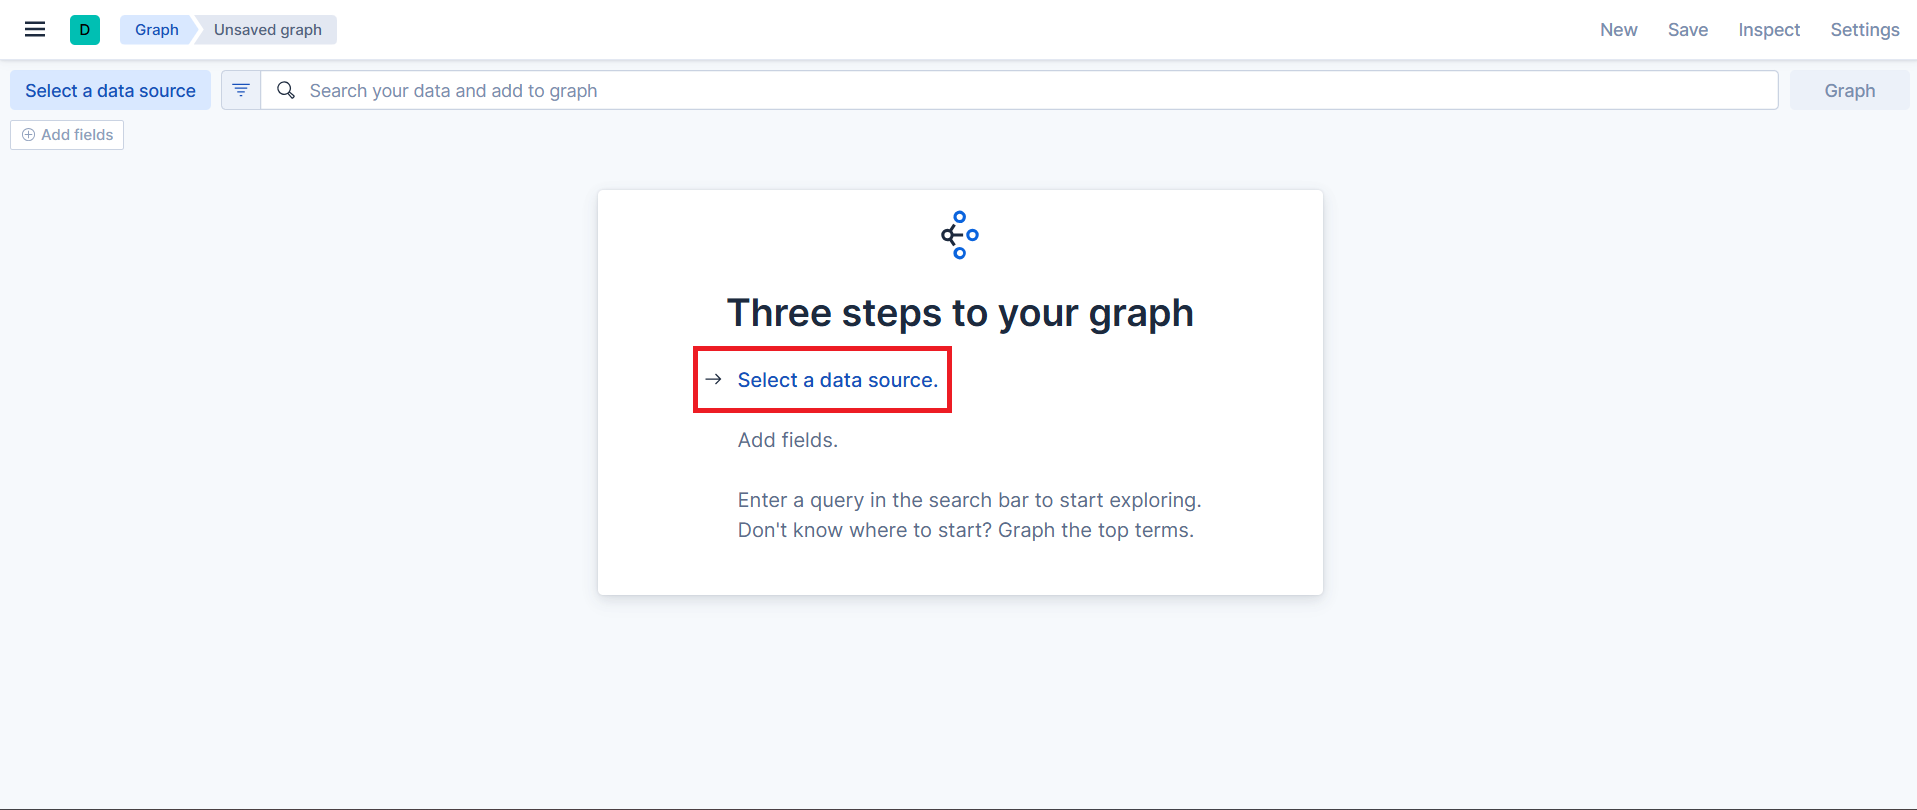
Choose the data source.
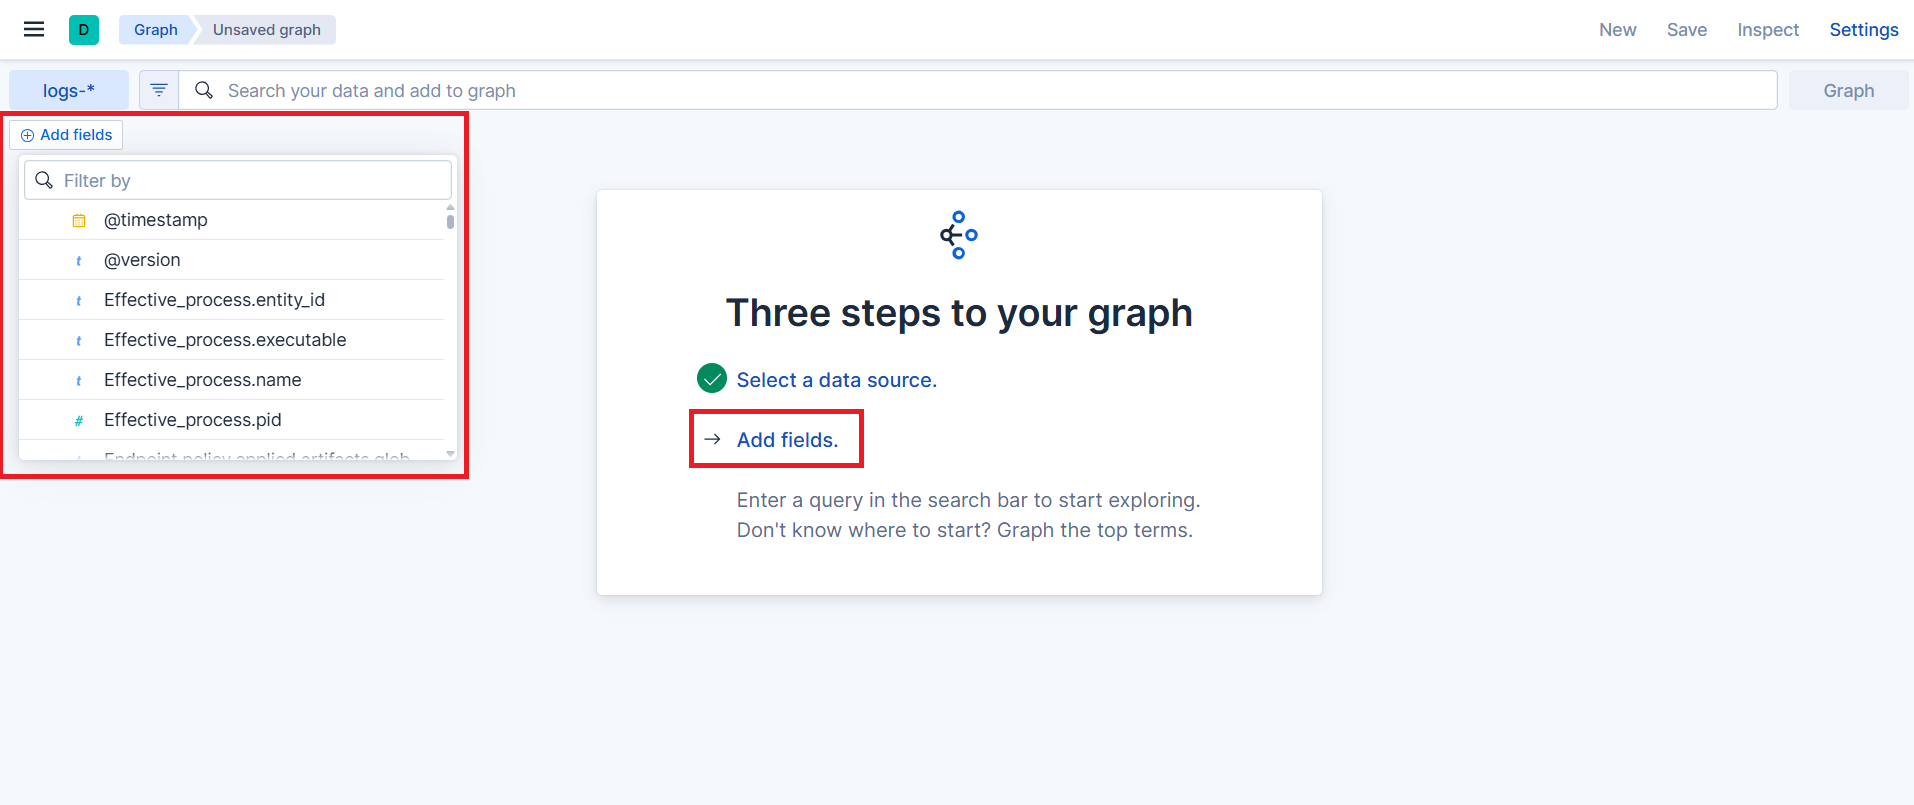
Choose the fields on which to build the graph.
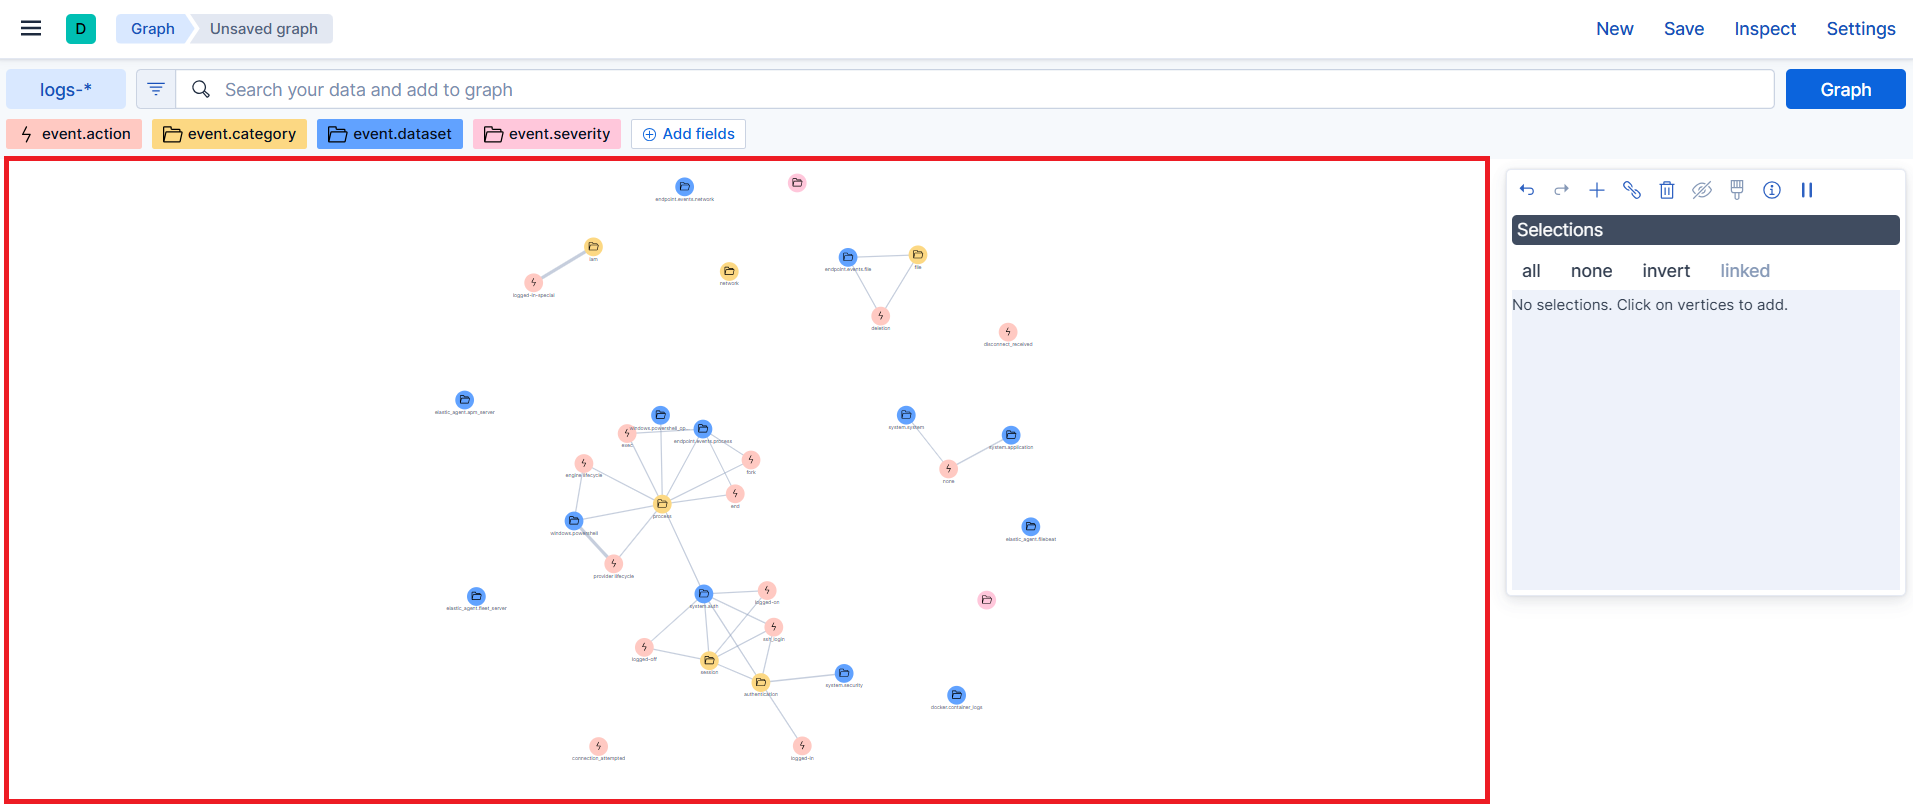
Enter a query in the search bar and click Graph, or click Graph the top terms to start exploring without a query.
The graph shows the relationships found between the selected fields.
See also
For more details on Graph features and options, see the official Elastic Graph documentation.

