


 ELK - Log Analytics
Machine Learning
Machine Learning Overview
Machine Learning in Kibana automatically detects anomalies, unusual patterns and significant changes in behavior in your data. It analyzes how data evolves over time, models what normal behavior looks like and highlights values, events or trends that differ from the expected pattern.
With manual analysis, you have to inspect charts, logs or metrics yourself. Machine Learning finds hidden or unexpected behavior automatically, even in large and complex datasets. This is especially useful when there is too much data to inspect visually, or when static thresholds alone can’t reliably identify abnormal behavior.
Machine Learning takes you beyond simply observing data to a more proactive form of analysis, where you can detect relevant deviations faster and investigate them more efficiently.
Roles and Permissions
Depending on the role defined by the contract with your organization, you might have different permissions:
VIEWER: Read
EDITOR: Read
ADMIN: Read
Machine learning analyses in Kibana run as jobs. Jobs are created on request; you cannot create or manage them directly with these roles. Once an anomaly detection job is running, you can review its results.
Kibana supports two types of machine learning: unsupervised and supervised.
Unsupervised Machine Learning
Unsupervised learning doesn’t require a training phase. The system detects patterns or unusual behavior itself directly from the data. The main approaches here are anomaly detection and outlier detection.
Anomaly detection works with time series data. It builds a probabilistic model of normal behavior and can run continuously to detect unusual events as they occur. Because the model evolves over time, it can also help you forecast future behavior.
Outlier detection doesn’t require time series data. It is a data frame analytics technique that identifies unusual records by comparing each data point with the others and evaluating how isolated it is within the dataset. The result is an enriched copy of the dataset in which each record has an outlier score that shows how abnormal it is compared to the rest of the data.
Supervised Machine Learning
Supervised learning requires a training dataset that includes known outcomes, such as categories for classification or measured values for regression. These outcomes may already be available in your historical data; otherwise, someone in your organization or an implementation specialist must prepare or label the data before training. Here, supervision means learning from known outcomes, not a person overseeing each prediction.
In Kibana, the main supervised data frame analytics types are classification and regression.
Both types of analysis produce:
A trained model
An enriched copy of the dataset, with predictions added to each record
You can then deploy the trained model to generate predictions on new data without manually labeling each new record.
Classification predicts a category or class. The model learns from historical data in which the expected outcome is already known. It then uses what it learned to assign new records to one of the possible classes. Use classification when the result is a label rather than a number, for example to decide whether:
An event is normal or suspicious
A transaction should be approved or rejected
A DNS request comes from a malicious or a benign domain
Regression predicts a numerical value. During training, the model learns the relationship between input fields and a known numerical outcome in historical records, such as a measured response time. It then uses this relationship to predict that outcome for new records. Use regression when the expected result is a measurable quantity, for example to estimate:
The response time of a web request
A cost
A duration or usage level
For more information, see the official Elastic Machine Learning documentation.
Machine Learning Overview Page
The Machine Learning Overview page is the main access point to the machine learning capabilities available in Kibana. It is the landing page of the Machine Learning area and helps you get to the right capability for your goal, whether you want to detect anomalies, statistically analyze data, explore logs or work with trained models.
The page is organized into functional areas. Each area contains action buttons that start a specific type of analysis.
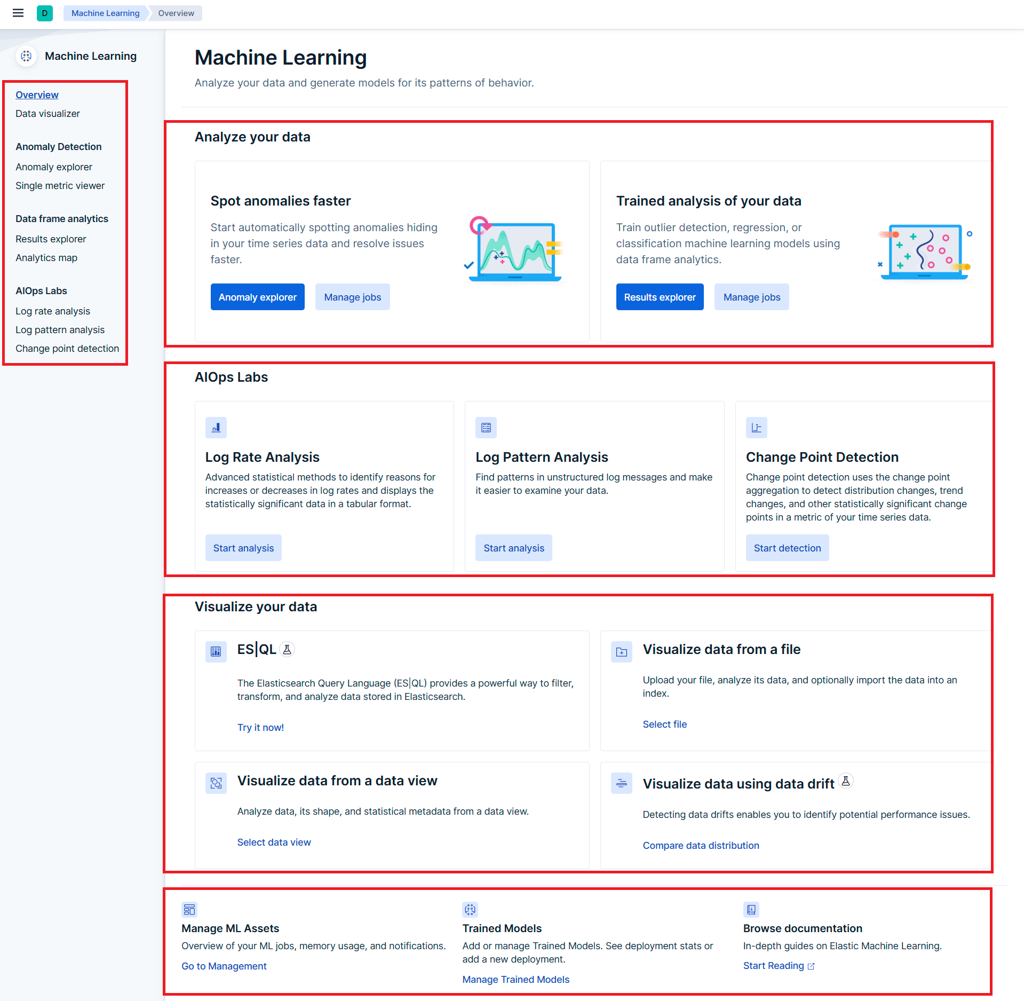
- Analyze your data
The main starting point for applying machine learning to your data. From here you can access anomaly detection in order to find unusual behavior, and data frame analytics in order to run trained analyses on datasets.
- AIOps Labs
Advanced analysis tools for operational investigations. Use them to find significant changes in log volume, recurring log patterns or shifts in metric behavior during troubleshooting and root cause analysis.
- Visualize your data
Data exploration and preparation. Use it to inspect, query, compare or upload data before you start a deeper analysis.
- Management and documentation
Quick access to management and support functions: ML asset administration, trained model management and the official documentation.
Tip
If you are not sure where to start, explore your data in Visualize your data first. Then move to Analyze your data for continuous analysis, or to AIOps Labs for on-demand investigation.
Investigating Anomalies
Once an anomaly detection job is running, you can review and investigate its results directly in Kibana through two complementary views.
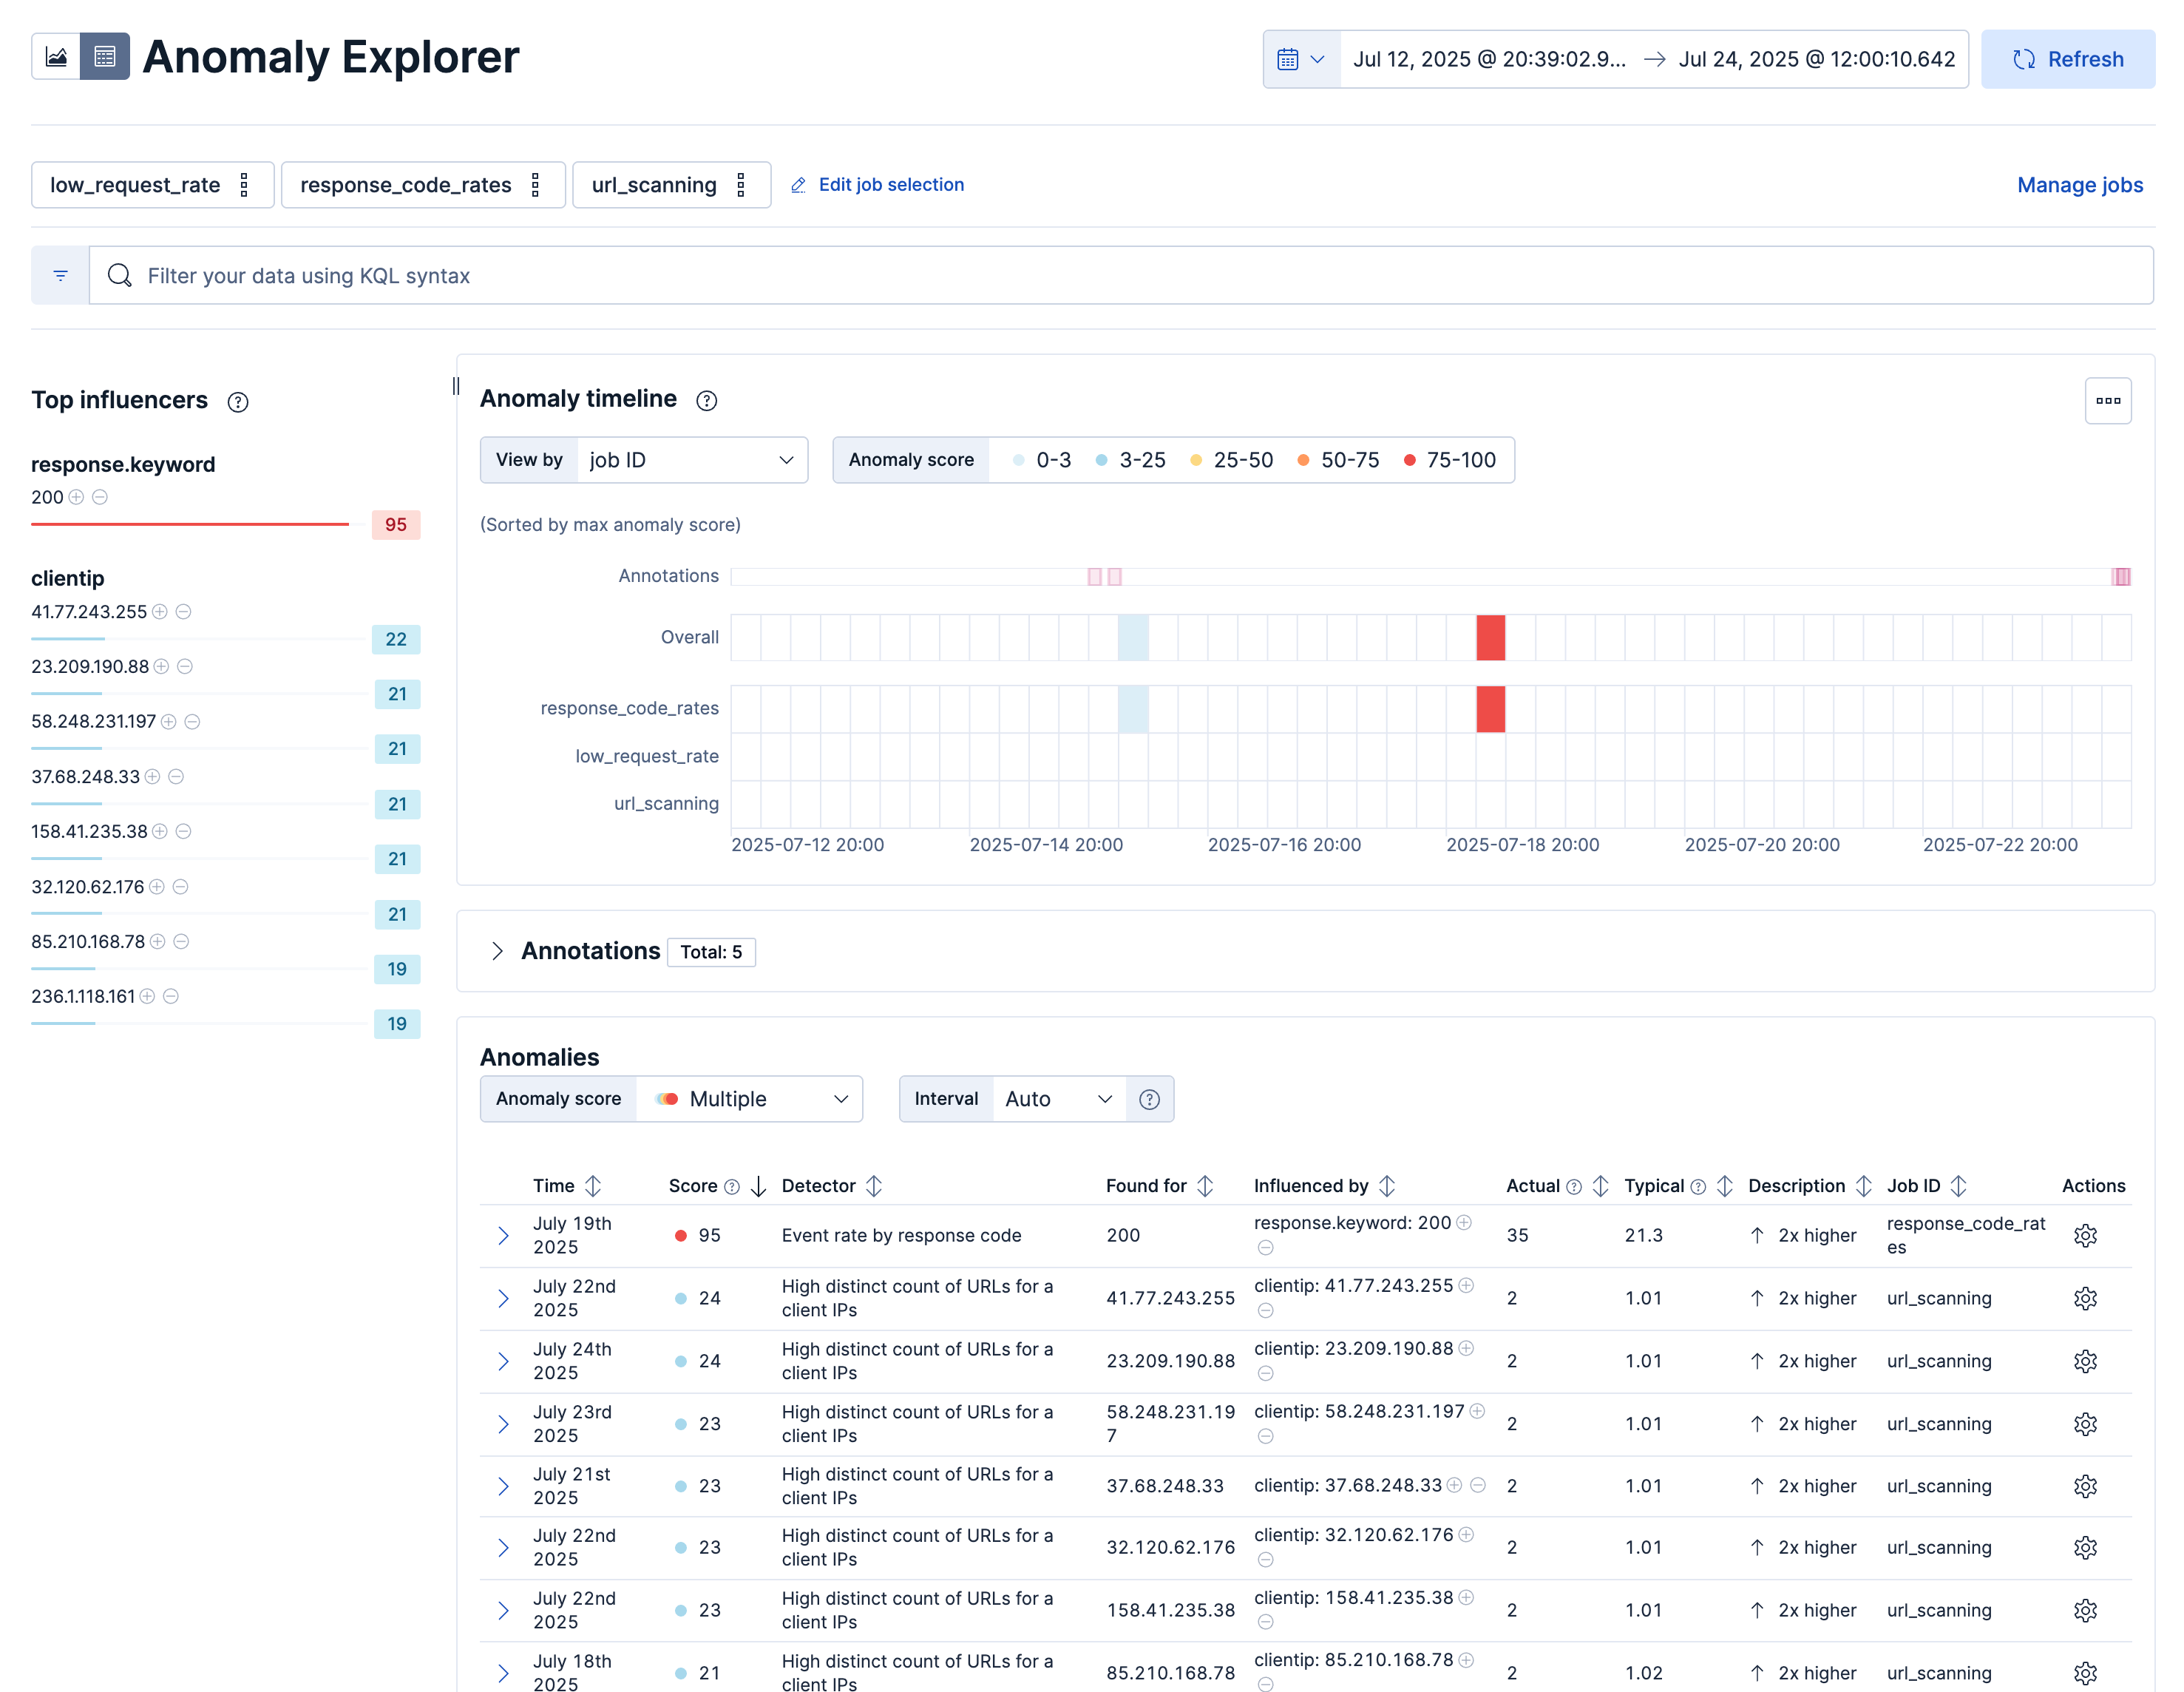
Anomaly Explorer gives an overview of the anomalies detected by one or more jobs and shows the entities most affected. It helps users understand when anomalies occurred, which services or transaction types were involved and how severe the detected behavior was.
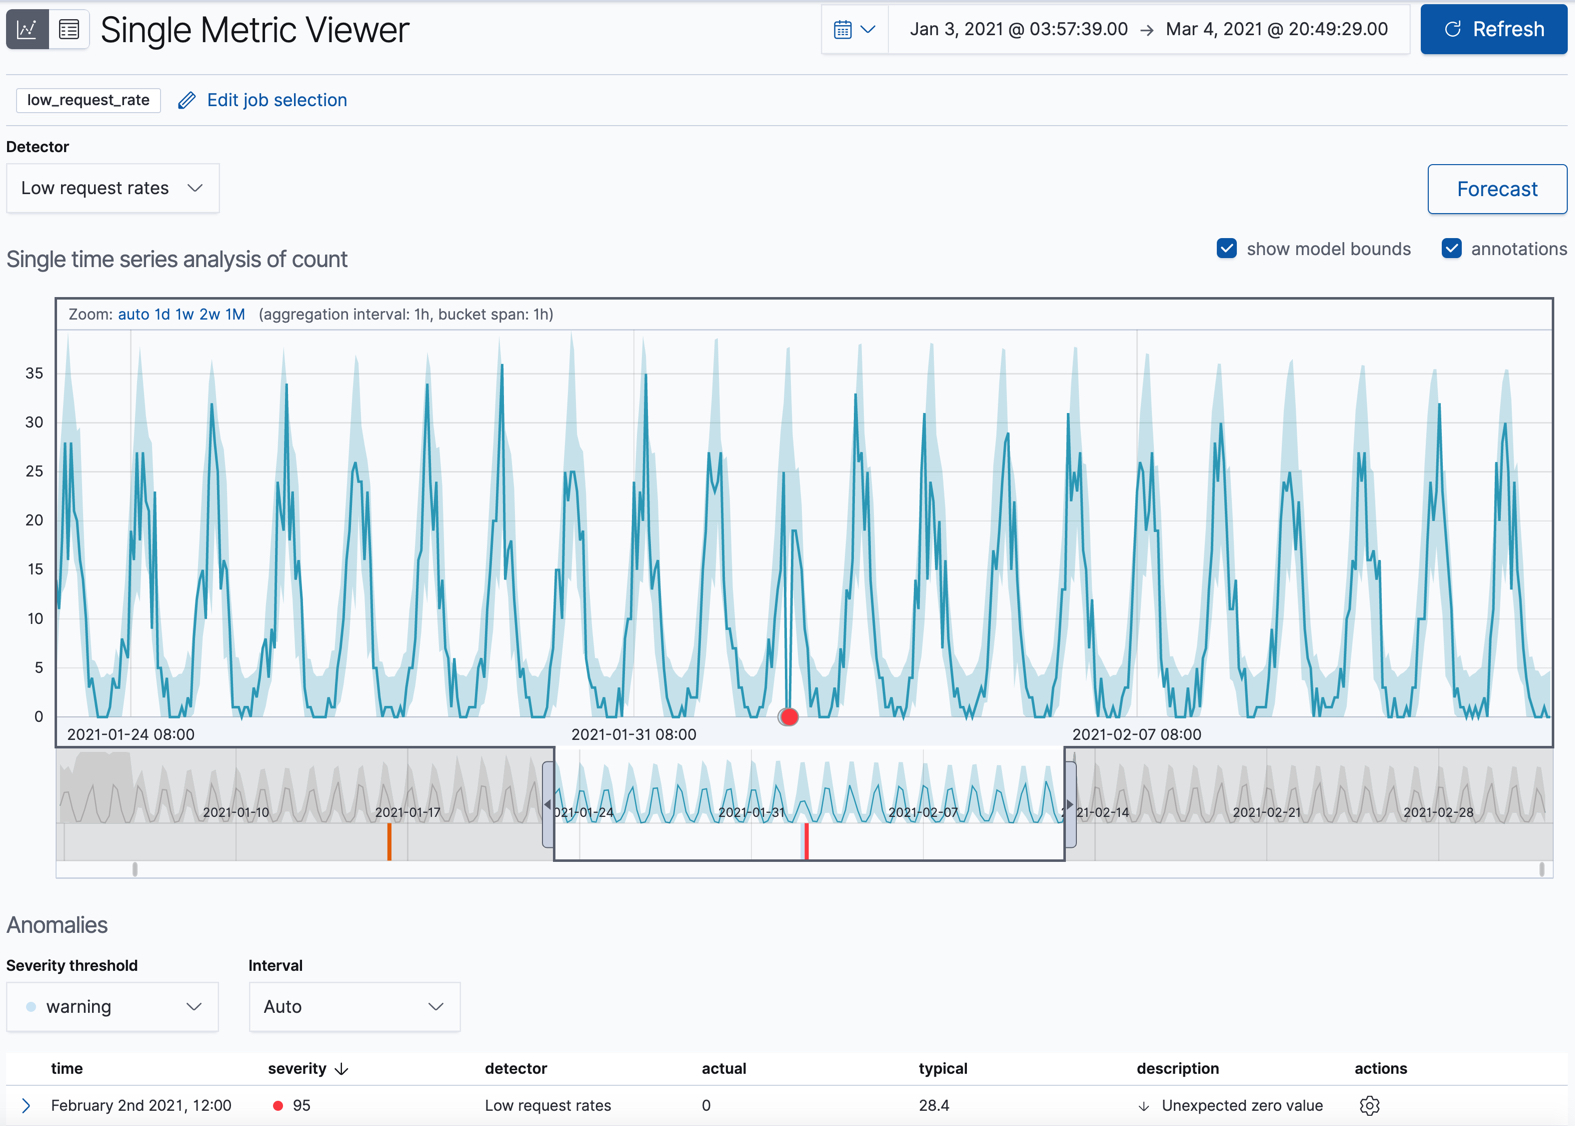
Single Metric Viewer focuses on a single metric series and compares its actual behavior with the expected baseline calculated by the model.
A typical analysis starts in the Anomaly Explorer, where you find out when anomalies occurred and which services or transaction types were involved. It then continues in the Single Metric Viewer to examine one specific metric in detail. Both views use the same controls for job selection, time range, and data refresh, so you can switch between them while keeping the same context.
Anomaly Explorer
The Anomaly Explorer is the main entry point for reviewing the anomalies detected by a job, for example a job that monitors APM data. It helps you understand when anomalies occurred, which services or transaction types were involved, and how severe the detected behavior was. To start, select the job whose results you want to review and set the time range of interest. You can change the job selection at any time, and a KQL filter lets you narrow the results further, for example to a specific service or environment.
Reading the results
The view combines three elements, which are best read from the general to the specific:
- Top influencers
Lists the field values that contributed the most to the detected anomalies, such as specific
service.nameortransaction.typevalues. Use it to quickly identify where the investigation should start.- Anomaly timeline
Shows the detected anomalies as a color-coded heatmap. The overall row summarizes the results of the whole job, while the rows below show individual influencer values, such as single services. The color intensity reflects the anomaly severity, so the time periods and entities with the most significant deviations stand out at a glance.
- Anomalies table
Lists each detected anomaly with its time, severity, detector, entity, influencers, and a short description. Comparing the actual value with the typical value calculated by the model shows how far the observed behavior differs from what was expected. From each record you can take further actions, such as opening the related data for a more detailed analysis.
By combining a visual overview with detailed records, the Anomaly Explorer helps you identify abnormal service behavior and supports troubleshooting activities.
Single Metric Viewer
The Single Metric Viewer analyzes one metric in detail and shows how it behaves over time
compared with the expected baseline. In addition to the job and time range, you select the
exact metric series to analyze by choosing the detector and the relevant entity values, such
as service.name and transaction.type. This lets you focus on one specific service
context, for example the latency of a single transaction type of a given service.
Actual versus expected behavior
The main chart shows the observed values of the selected metric together with the model bounds, which represent the normal range expected by the model. Anomalies are highlighted directly on the chart, so spikes or unusual values outside the expected range are easy to spot.
When available, the Forecast option projects the future behavior of the metric based on the model. A compact timeline below the chart shows anomaly markers across the full period, placing individual anomalies in a broader time context, while annotations can mark relevant events, such as deployments or maintenance windows, that may explain certain anomalies.
Anomaly records
As in the Anomaly Explorer, the Anomalies table lists the records for the selected metric, including time, severity, detector, entity, influencers, and description. Use the actual and typical values to evaluate how much the observed behavior deviates from what is expected. Together, the chart and the records give you a focused view of one metric series and help you understand abnormal behavior in a specific service context.
For more details on viewing and interpreting anomaly detection results, refer to the official Elastic documentation.

