


 ELK - Log Analytics
Maps
Maps lets you visualize and analyze geospatial data on interactive maps. Use it to display documents, events or metrics that contain geographic information, so you can see more easily how data is spread across locations and spot geographic patterns. For a full description of every feature, see the official Elastic documentation on Maps.
Roles and Permissions
Depending on the role defined by the contract with your organization, you might have different permissions:
VIEWER: Read
EDITOR: Create, Read, Update and Delete
ADMIN: Create, Read, Update and Delete
With Maps you can:
represent data on a map
analyze events or metrics by location
identify geographic concentrations or distributions
combine multiple layers of geographic information
interact with the map through zoom, filters and exploration tools
Maps is useful when your data includes coordinates, regions or other geographic fields and you need a spatial view of the information.
Create a Map
To create a map, click Add layer. This is the action you use to add data to the map. The available options are grouped into three categories:
- Elasticsearch
Add layers based on data stored in Elasticsearch. Use this option to create layers from indexed documents that contain geographic fields, such as coordinates, shapes or other location data. This is the option to choose when the map needs to show operational data coming directly from Elasticsearch.
- Reference
Add reference layers that give geographic context to the map. These layers don’t contain your main business or observability data. Instead, they provide supporting information, such as boundaries, regions or base reference elements, that helps you interpret the data visually.
- Solutions
Add layers related to specific Elastic solution features. These are ready-to-use options for particular use cases. What’s available depends on the configuration and the capabilities enabled in your environment.
In short, choose the layer type that best fits your data:
Elasticsearch for indexed geospatial data
Reference for contextual geographic layers
Solutions for solution-specific map integrations
After choosing the layer type, configure how the data is displayed and then add the layer to the map.
Example: Add a Layer from Elasticsearch Documents
In this example, select the Documents option in the Elasticsearch category:
Choose the data view:
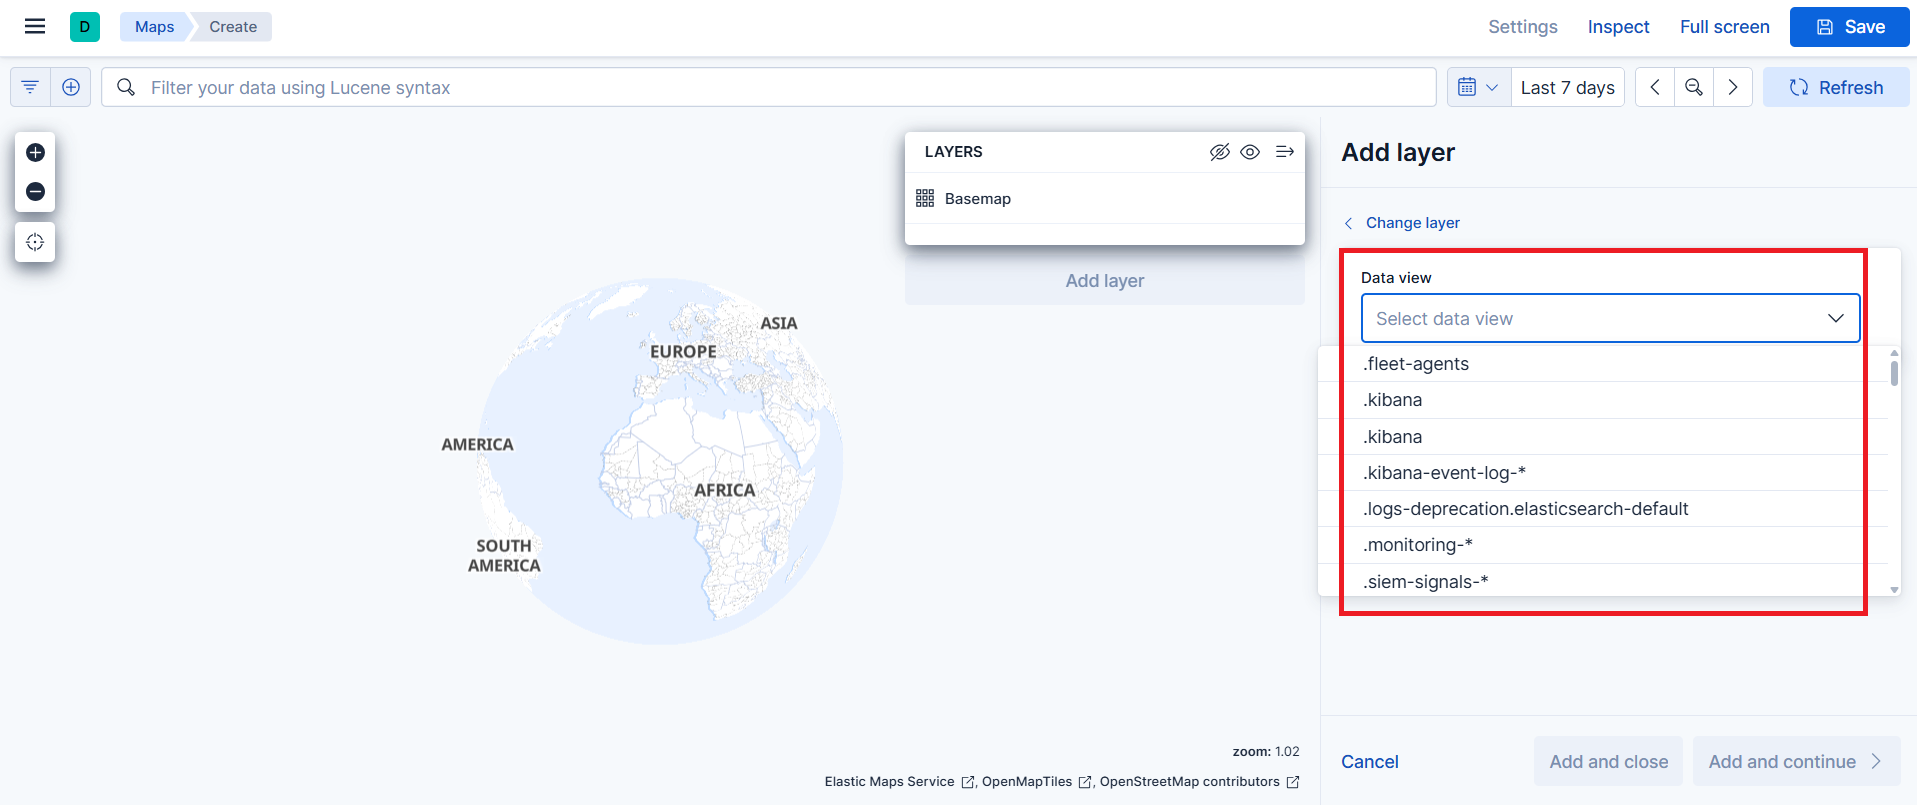
Choose the geo_point field to use for the map:
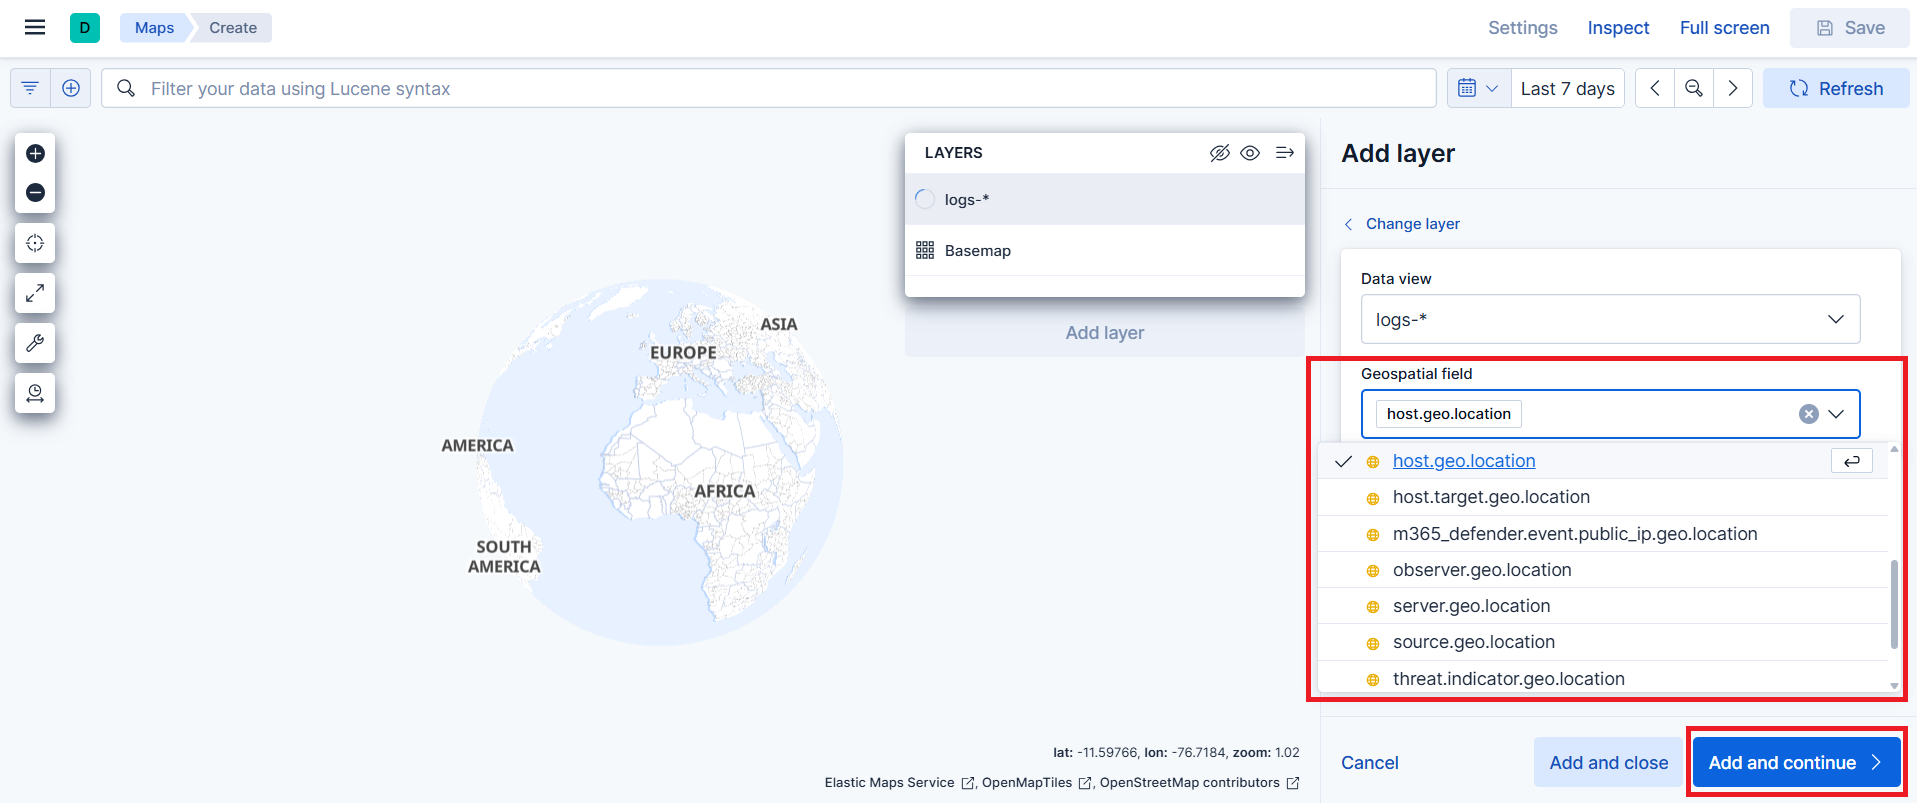
Configure the layer. The following options control how data is displayed and how you interact with it on the map:
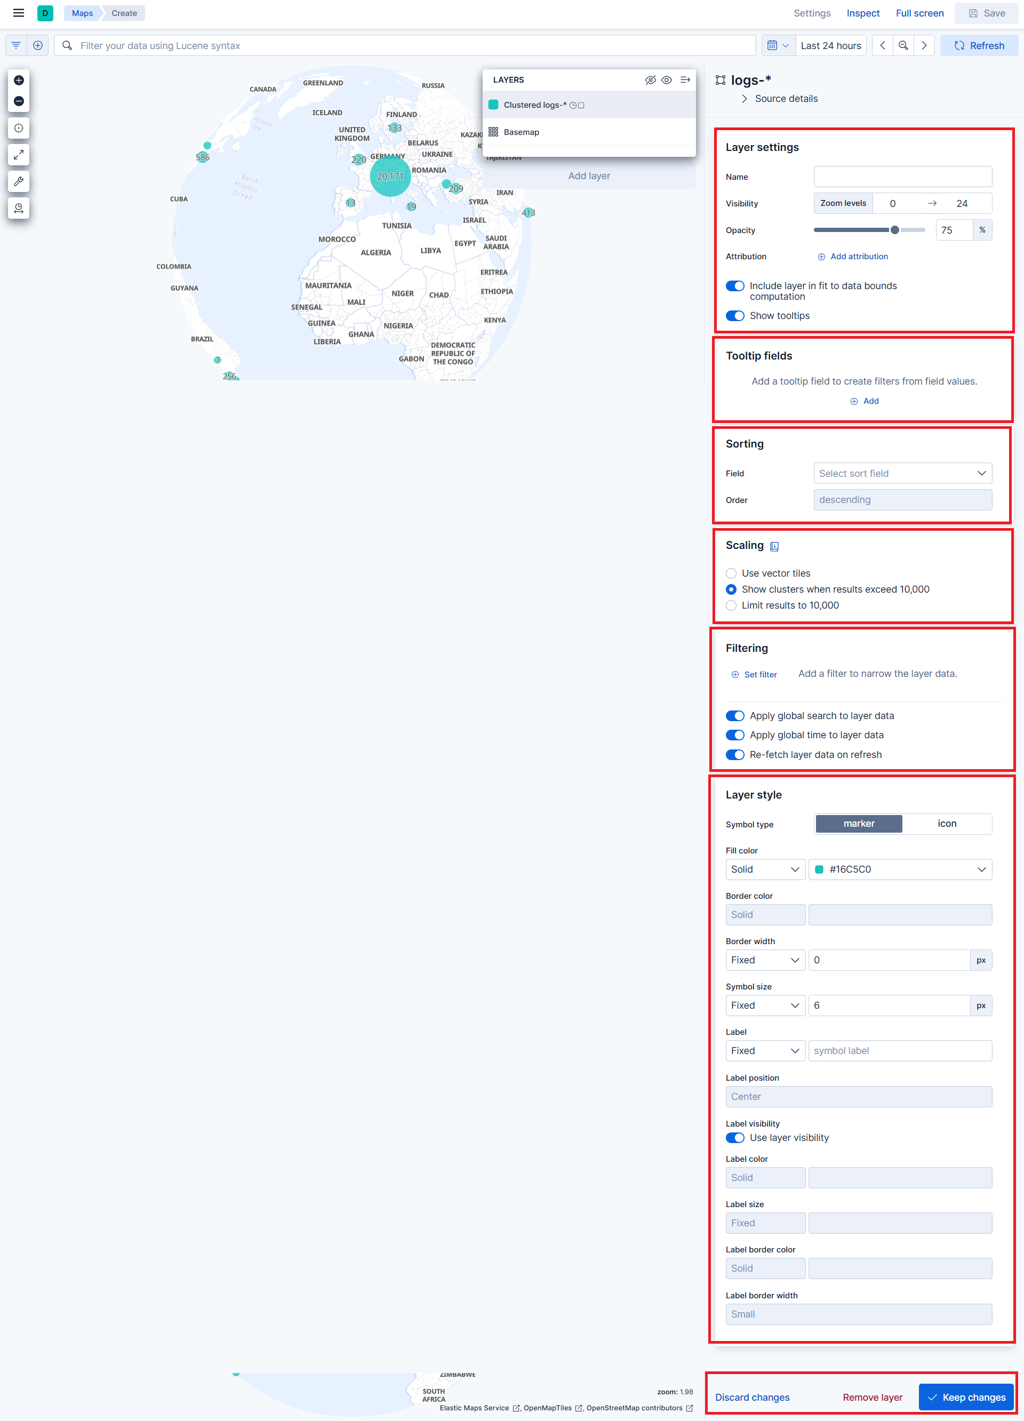
Layer settings: the general configuration of the layer, such as name, visibility and basic behavior
Display fields (tooltip fields): the fields shown when you hover over or click a feature on the map
Sorting: the order in which documents are drawn, which affects visibility when multiple points overlap
Scaling: how many documents are shown and how they are grouped when there are a lot of them
Filter: limits the documents included in the layer
Layer style: the visual appearance of the layer, such as colors, icons, labels and symbol style
Further reading: Maps in the Elastic documentation.

