


 ELK - Log Analytics
Visualize Library
Visualize Library is where you create, store and manage reusable visualizations, such as charts, tables, metrics and maps. Each visualization is saved as its own object, separate from any dashboard, so you can find, open and maintain all your visualizations in one place.
Visualize Library and Dashboards
A dashboard is the page where you arrange and view panels side by side. Visualize Library is where you keep the visualizations those panels can show.
You can create a chart directly inside a dashboard. That chart belongs only to that dashboard: it isn’t listed in Visualize Library, and if you want it on another dashboard you have to rebuild or copy it. A visualization saved in Visualize Library can be added to any number of dashboards, and every dashboard shows the same saved object.
This matters most when the same view of the data is needed in several places:
Reuse: build a visualization once and add it wherever it’s needed, instead of recreating it for each dashboard.
Single point of maintenance: when you change a saved visualization, for example by adjusting a metric or a filter, the update shows up on every dashboard that uses it.
Consistency: all teams and dashboards show the same data the same way, which avoids small differences between copies.
Overview: the library lists all saved visualizations, so you can check what already exists before you build something new.
You build a visualization the same way in Visualize Library as you do a Dashboard. The only difference is where it’s saved. Use a chart inside a Dashboard for something that particular dashboard needs, and Visualize Library for anything you plan to reuse or share.
Roles and Permissions
Depending on the role defined by the contract with your organization, you might have different permissions:
VIEWER: Read
EDITOR: Create, Read, Update and Delete
ADMIN: Create, Read, Update and Delete
Visualization types
The main page lists your existing visualizations. Open one to view or edit it, or click Create visualization to start a new one. You can choose from three types:
Lens: the standard way to build charts, tables and metrics. You drag and drop fields to build them.
Maps: shows data on interactive maps, so you can analyze events, metrics or assets by location.
Custom visualization: advanced or specialized chart types. Use these when you need more control over the configuration or a particular format.
Create a Lens Visualization
Click Lens to open the editor. The available fields are listed on the left, and you build the visualization in the central area. To add a field, drag it onto the chart, or drop it into the Horizontal axis, Vertical axis or Breakdown slots.
To create a Lens visualization:
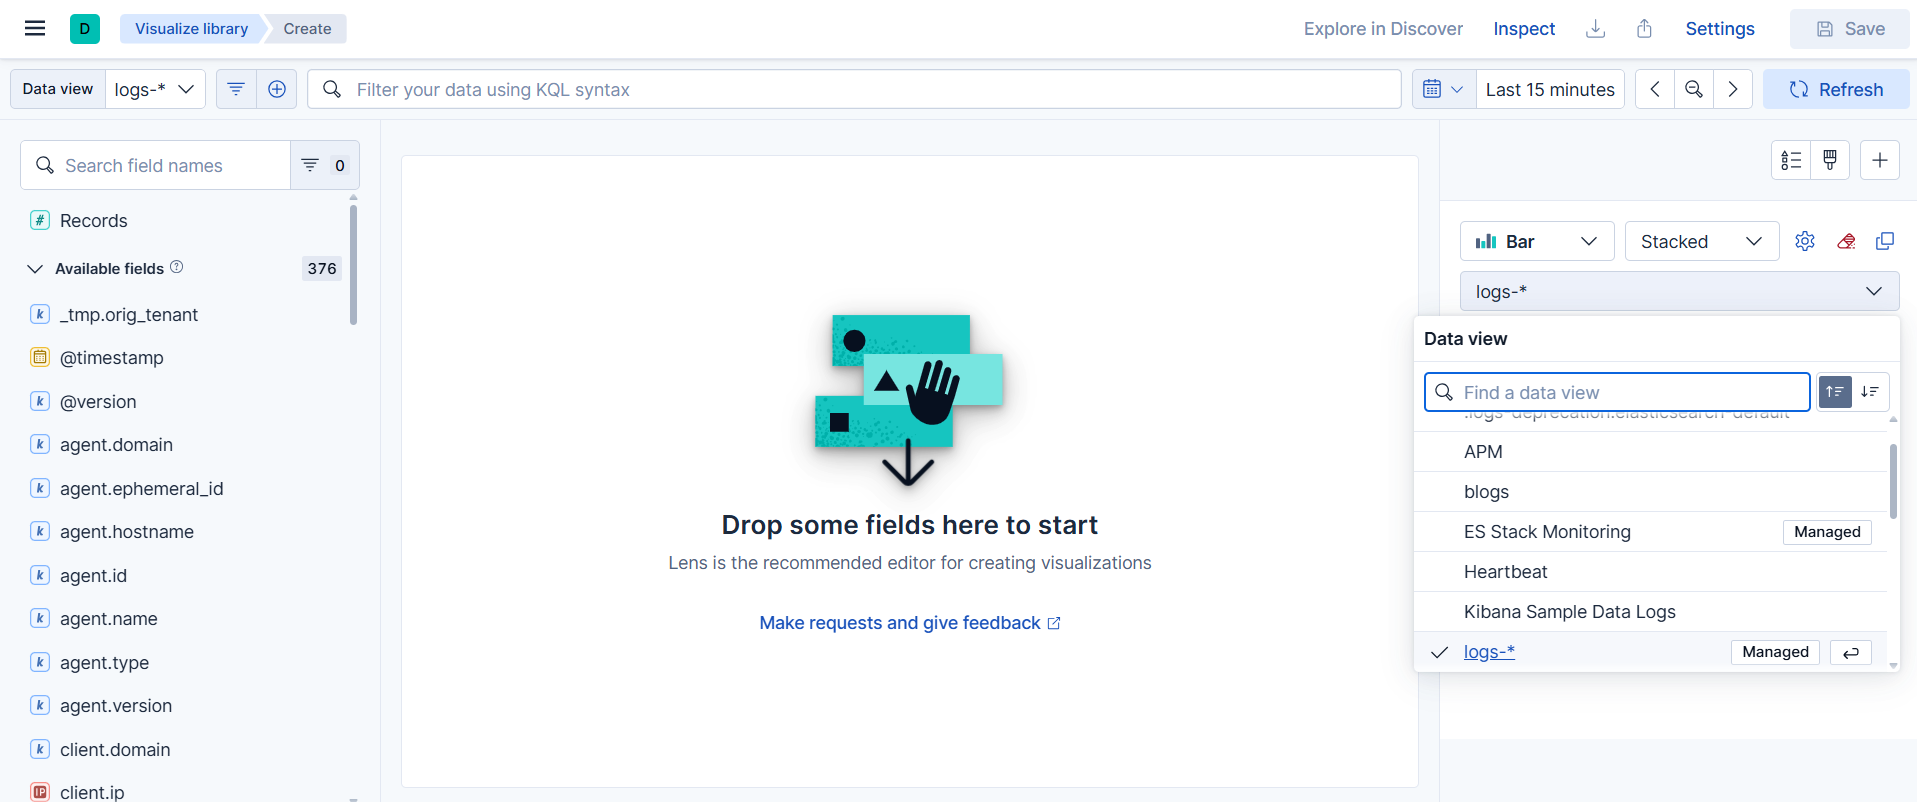
Select the data view: Choose the dataset you want to work with. The list of available fields depends on this choice.
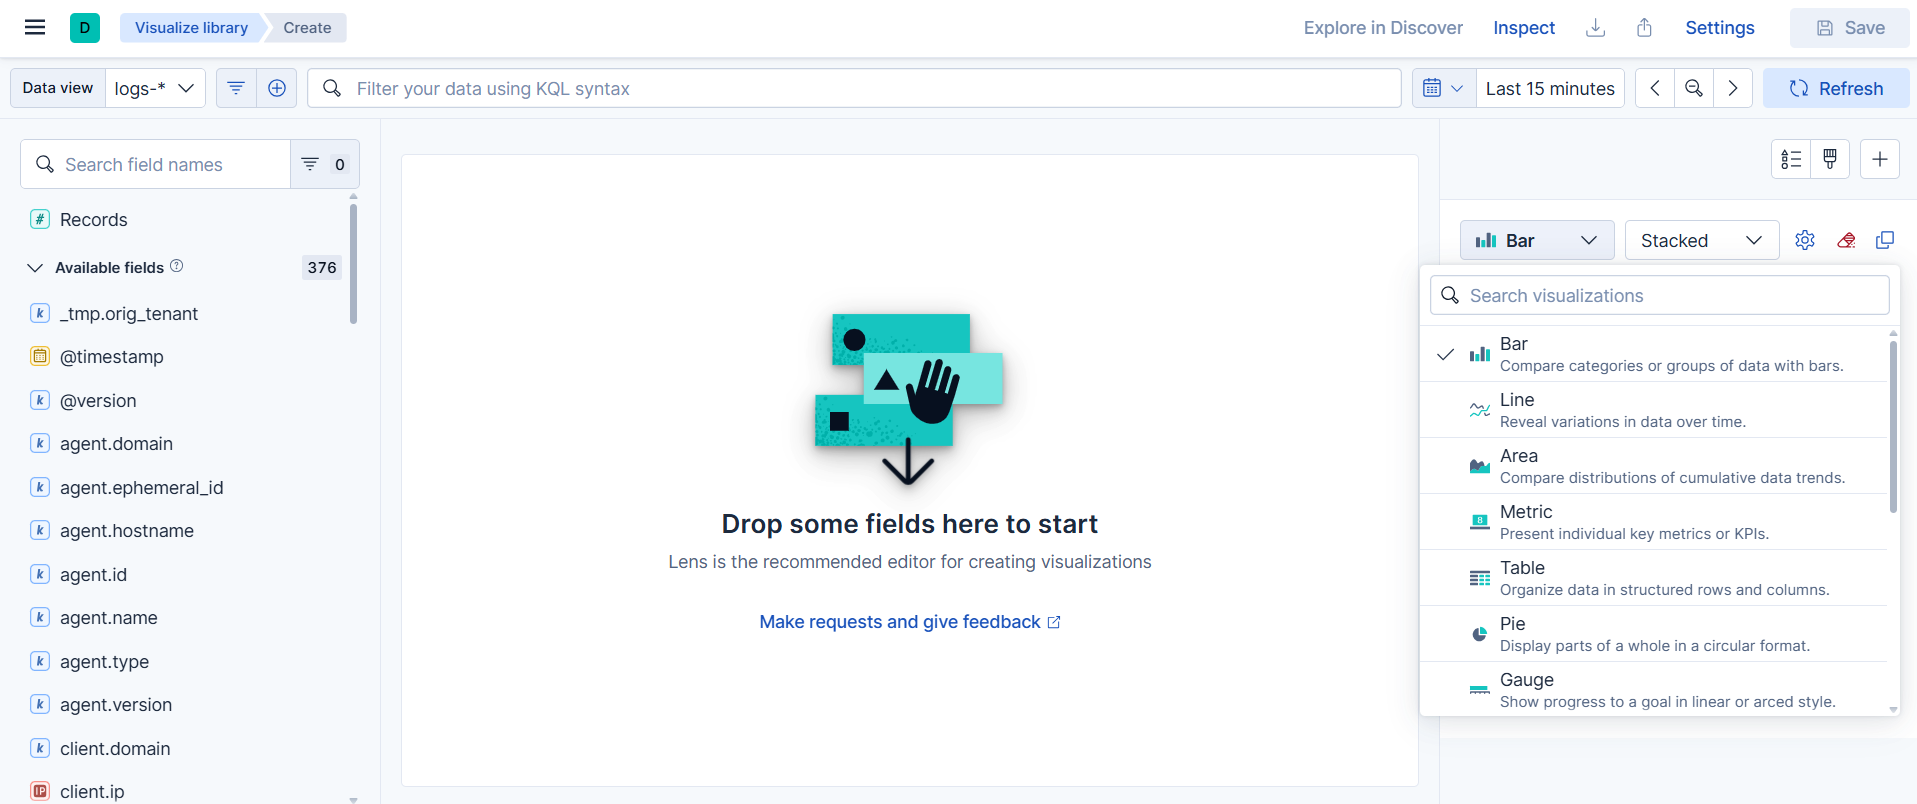
Choose the visualization type: Lens suggests a chart type based on the fields you add. You can switch to another type at any time: bar, line, area, pie, table, metric or heat map.
Add fields: Each field plays one of two roles in the chart:
Dimension: defines how the data is grouped, for example along the horizontal axis or as a breakdown.
Metric: the value that’s calculated for each group.
The type of field usually determines its role. Date fields show trends over time, text or categorical fields split data into categories, and numeric fields are aggregated into values.
Configure the fields: Click a field in the chart configuration to choose how it’s processed.
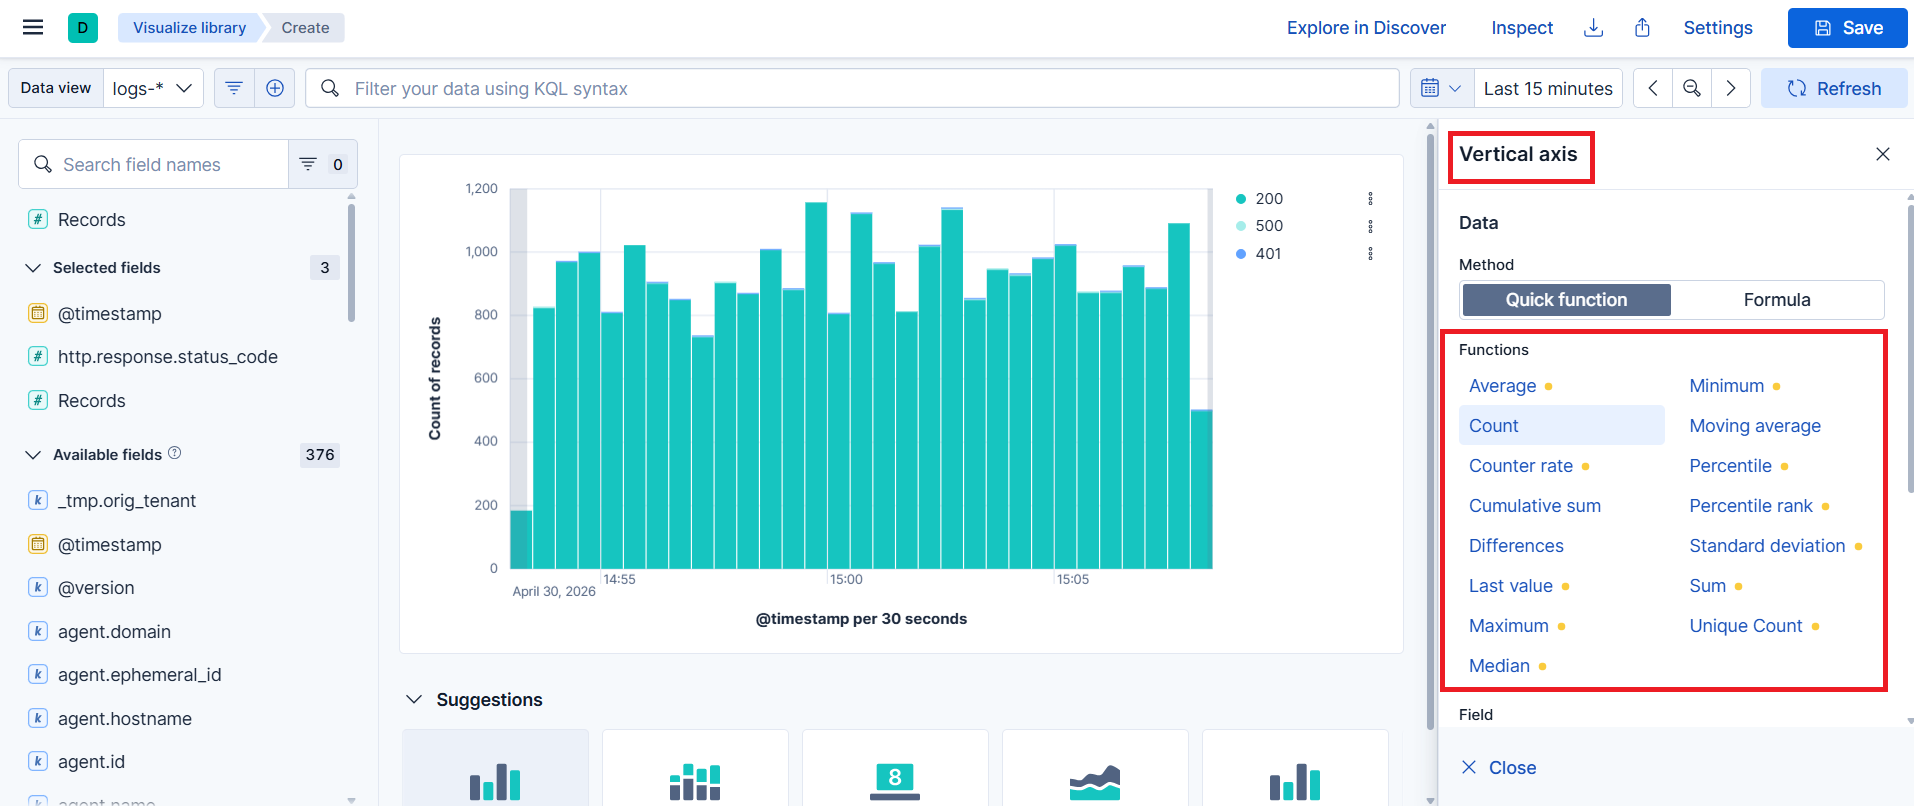
For metrics:
Count: number of documents
Sum: total of a numeric field
Average: mean value of a numeric field
Minimum and Maximum: lowest and highest values
For dimensions:
Date histogram: groups data by time interval to show trends across the selected time range
Top values: shows the most frequent values of a field
Intervals: groups numeric values into ranges of a size you set
Filters: groups data by conditions you define
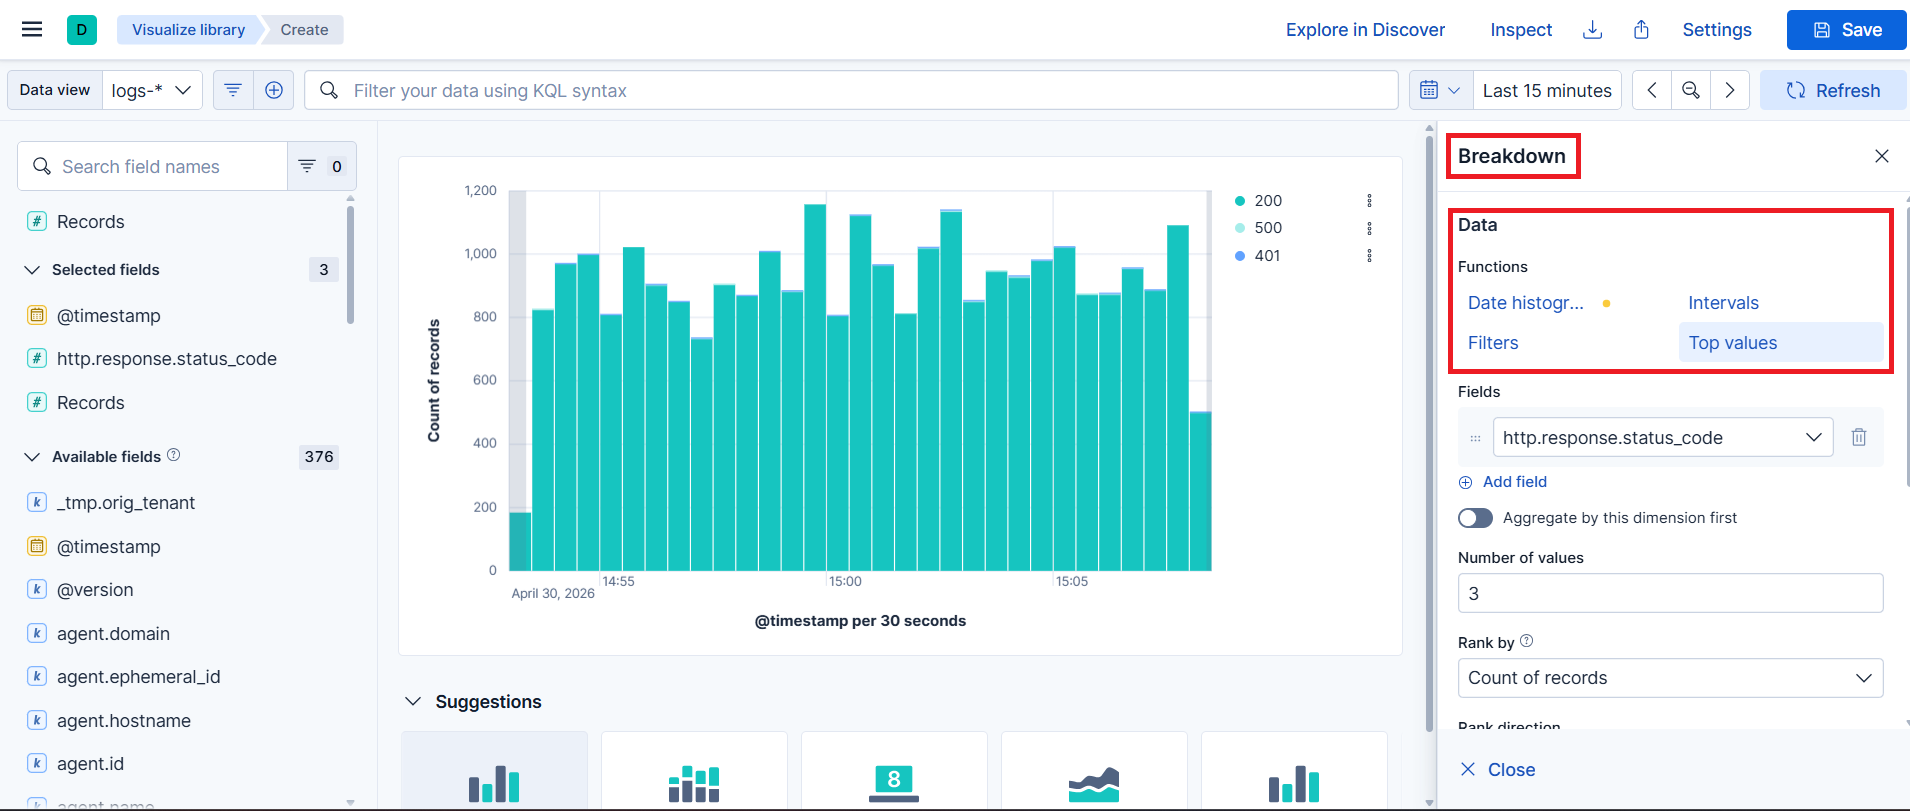
Example: put
@timestampon the horizontal axis, Count on the vertical axis andhttp.response.status_codeas the breakdown. The chart shows the number of requests over time, split by response code.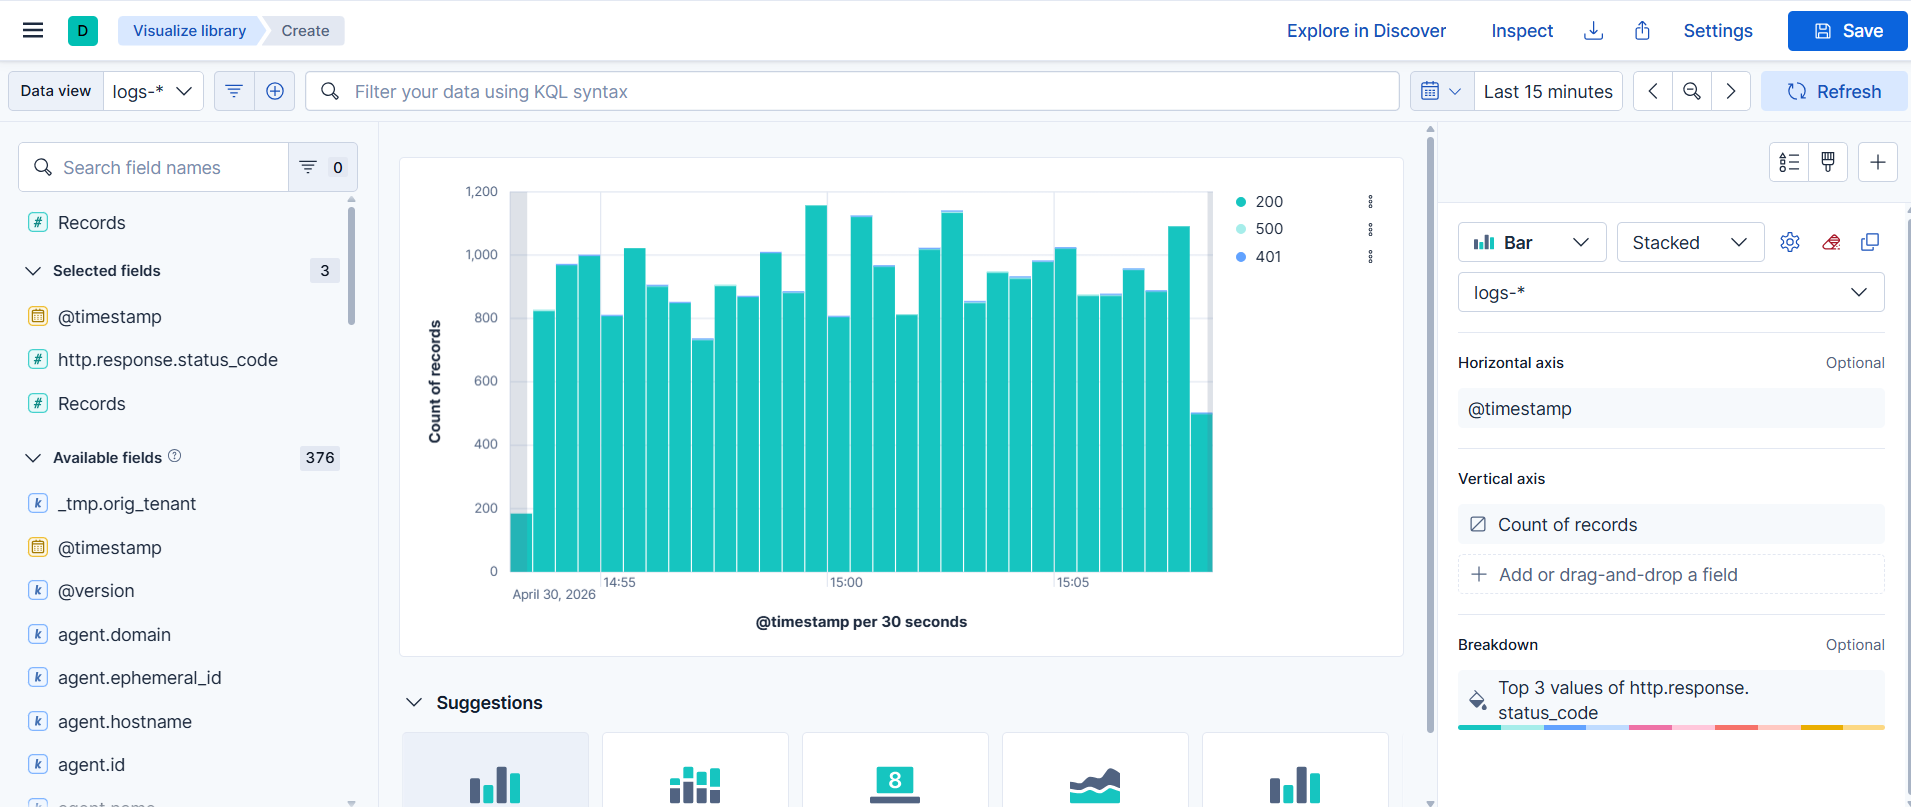
Save the visualization: When the visualization is ready, save it to Visualize Library so it can be reused, or add it directly to a dashboard.
Create a Maps visualization
For details, see the Maps section.

