


 ELK - Log Analytics
Synthetic Monitoring
The Synthetics section monitors websites, APIs, services and applications through simulated checks. These checks help you verify their availability and detect failures, slow responses or intermittent problems before they affect real users.
Roles and Permissions
Depending on the role defined by the contract with your organization, you might have different permissions:
VIEWER: Read
EDITOR: Create, Read, Update and Delete
ADMIN: Create, Read, Update and Delete
Monitor
A monitor in ELK is a configured check that runs automatically at defined intervals. Choose between two categories according to what you need to verify.
Lightweight Monitors
Lightweight monitors check availability and connectivity without opening a browser:
- HTTP checks that a website or API returns an expected status code
or response content.
TCP checks that a service accepts connections on a specified port.
- ICMP checks that a host is reachable over the network, but does not
confirm that a service on it is working.
Browser Monitors
Browser monitors test application behavior by simulating user interactions in a real browser, such as signing in, navigating pages or submitting forms. Unlike lightweight checks, they can detect broken user interaction flow and frontend performance problems even when an endpoint responds successfully.
Monitor Status and History
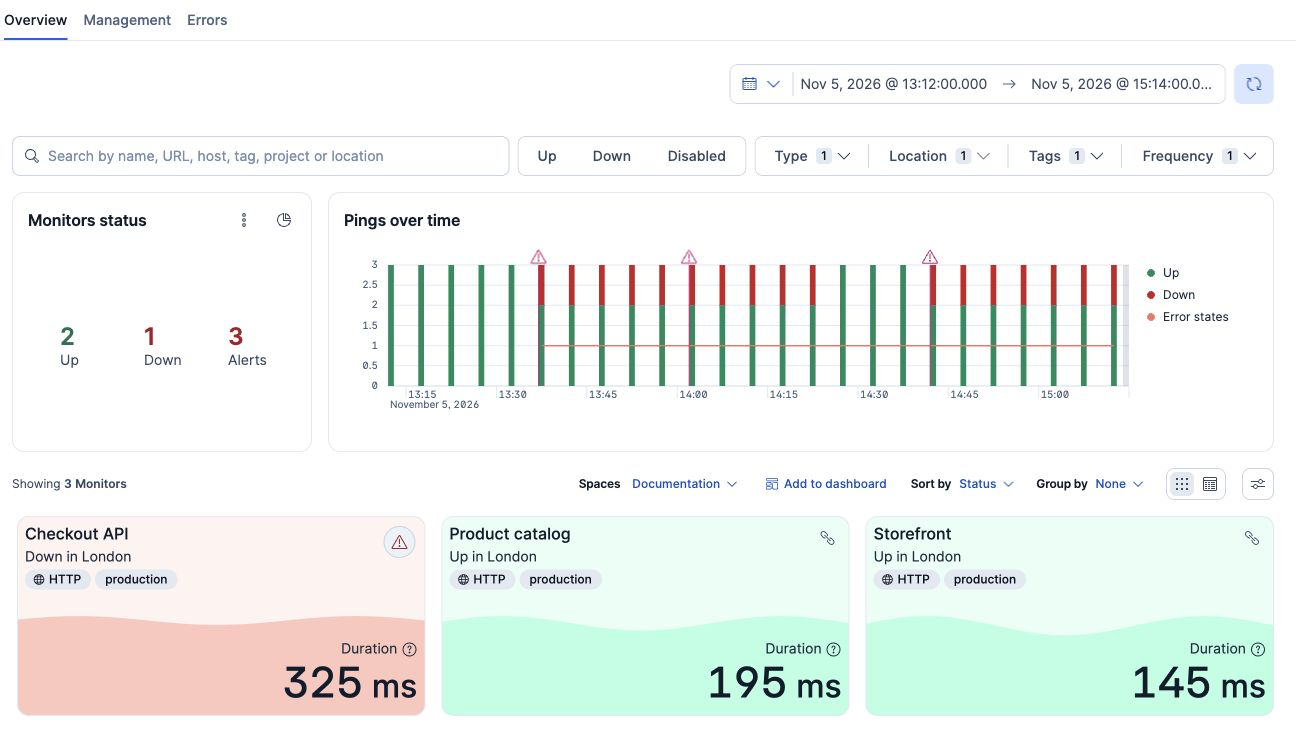
The Overview tab helps you see which monitors need attention and when checks failed:
- Monitors status summarizes the monitors by state, such as
Up or Down.
- Pings over time shows successful checks in green and failed checks
over the selected period in red. Alert markers show when alerts started.
- Monitor cards show each target’s check type, location, status and
average duration. A monitor running from several locations appears separately for each location, so you can spot location-specific problems.
Use filters to focus on the relevant monitors and the time picker to examine the incident period. Check the history to distinguish a one-off failure from a recurring problem, since a monitor that is Up now may still have failed earlier.
Create a Monitor
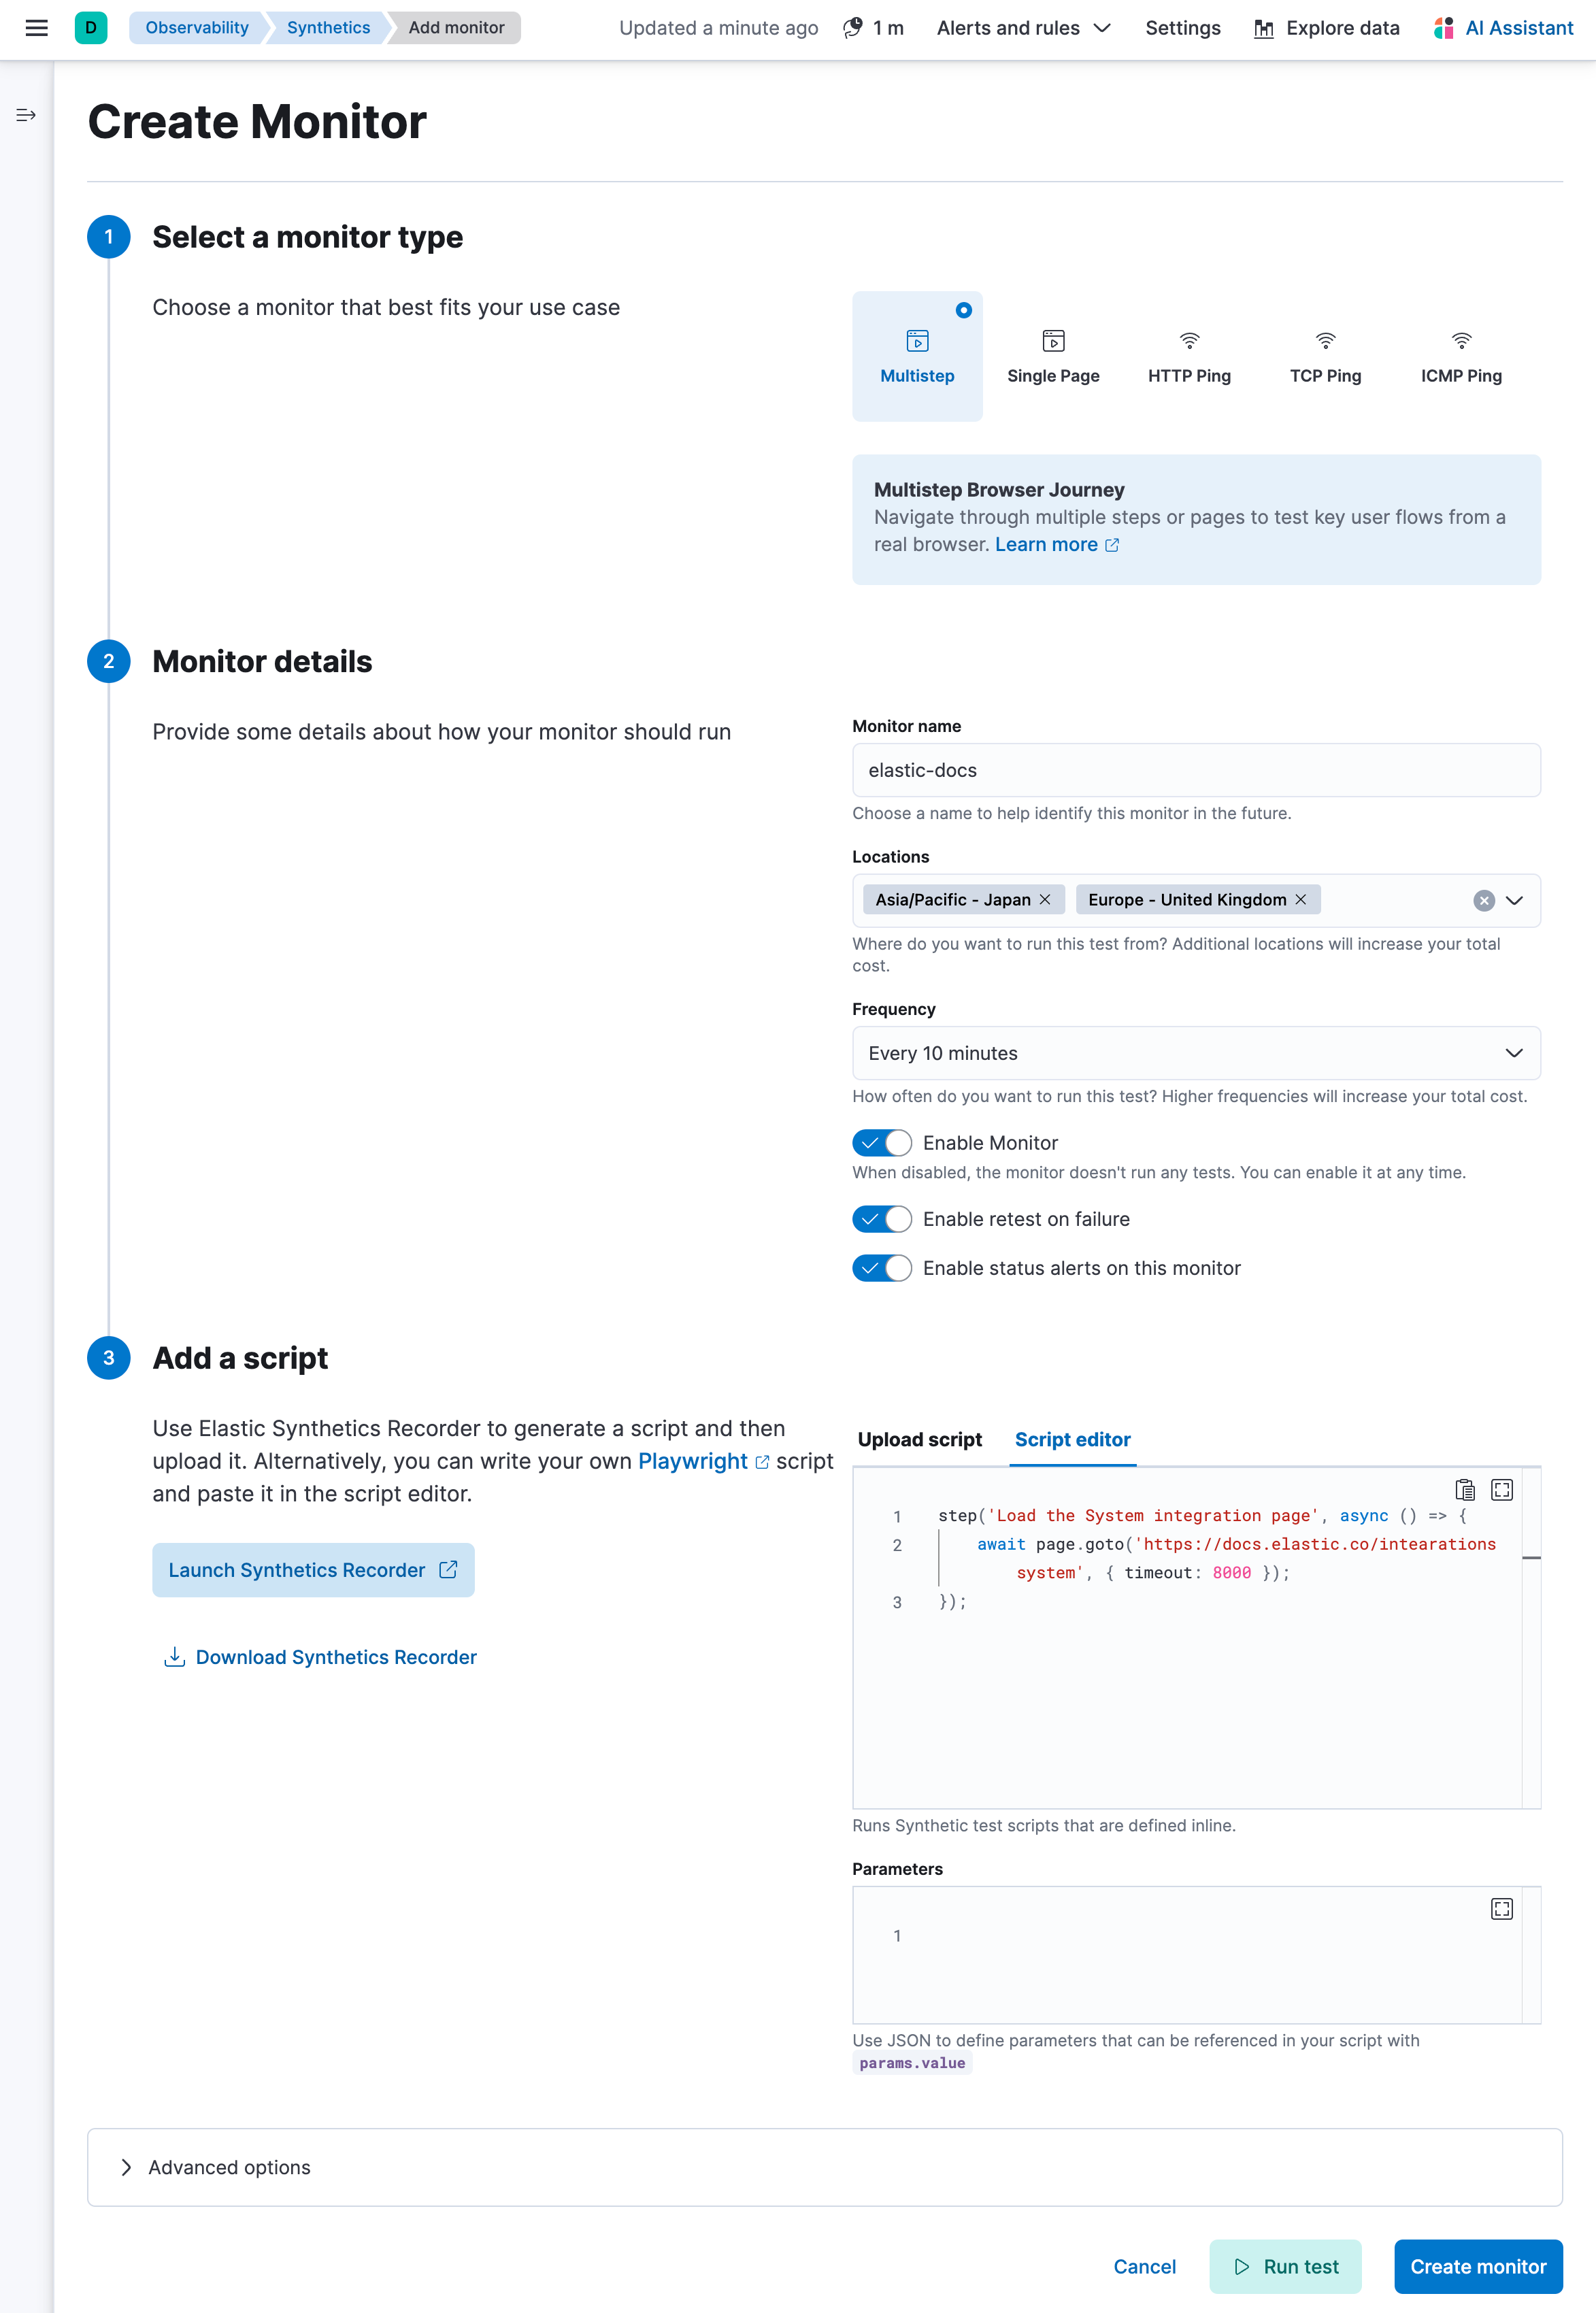
When you need a new check and have permission to create monitors, select Create monitor. Choose a monitor type, give it a recognizable name, and select its execution locations and frequency. Locations let you check the target from different network or geographic perspectives; frequency determines how often the check runs.
The form shown below selects Multistep for a browser flow. Add the browser test script in the Script editor, or upload a script generated with the Elastic Synthetics Recorder. The script defines the interactions and checks that the browser will perform. Use Run test (where available) to validate the check before selecting Create monitor.
Monitor Analysis
Select a monitor card to open its summary panel, then click Go to monitor to open the full details page. The panel’s Duration chart shows how execution time changes; where a comparison for a previous period is displayed, use it to identify whether checks have become slower than before.
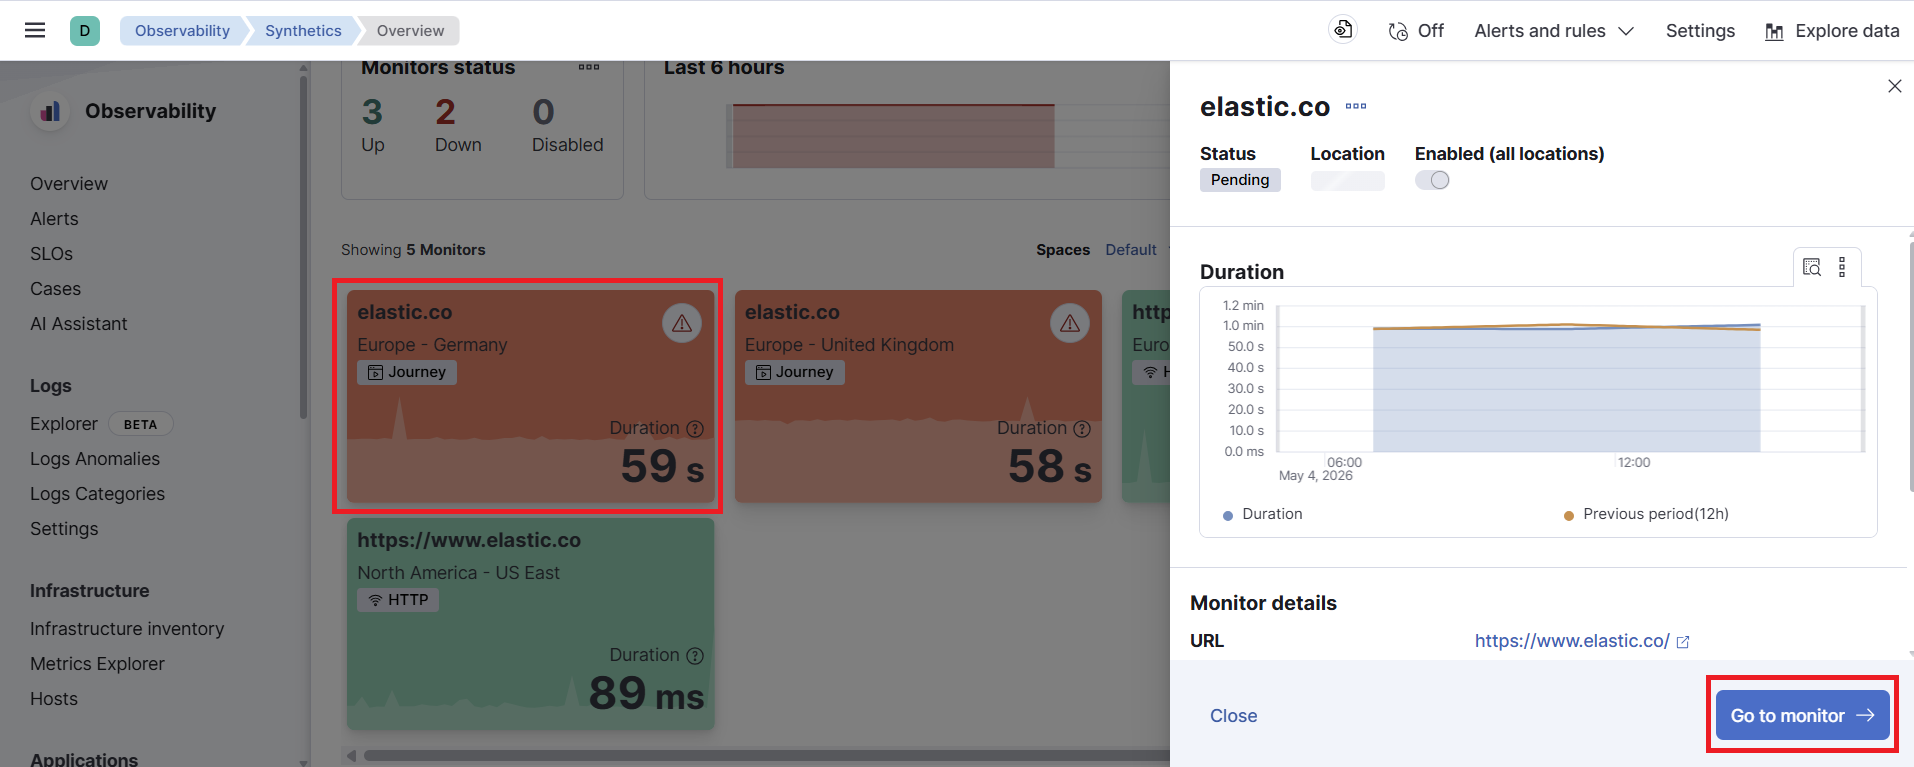
On the monitor details page, check the monitor name, type and location to confirm which target and execution location you are investigating. Use the following tabs to narrow down the problem:
- Overview: examine availability, duration trends and errors to
understand the monitor’s behavior over time.
- History: review individual executions and their outcomes during
the period of interest.
Errors: focus on failed checks and the available failure details.
For browser monitors, open an individual run to investigate its test steps. Compare a failed or slow step with a successful run to understand what changed. Error messages, timings and captured screenshots, where available, help distinguish a broken interaction from a slow page or request.
See also

